

What a disastrous week, there’s no way around that. A 9 game homestand against teams you should go 6-3 or better against, ends up 3-6. Yikes.
Consequently, there’s been a nosedive in the Astros odds of winning the West and/or making the playoffs.
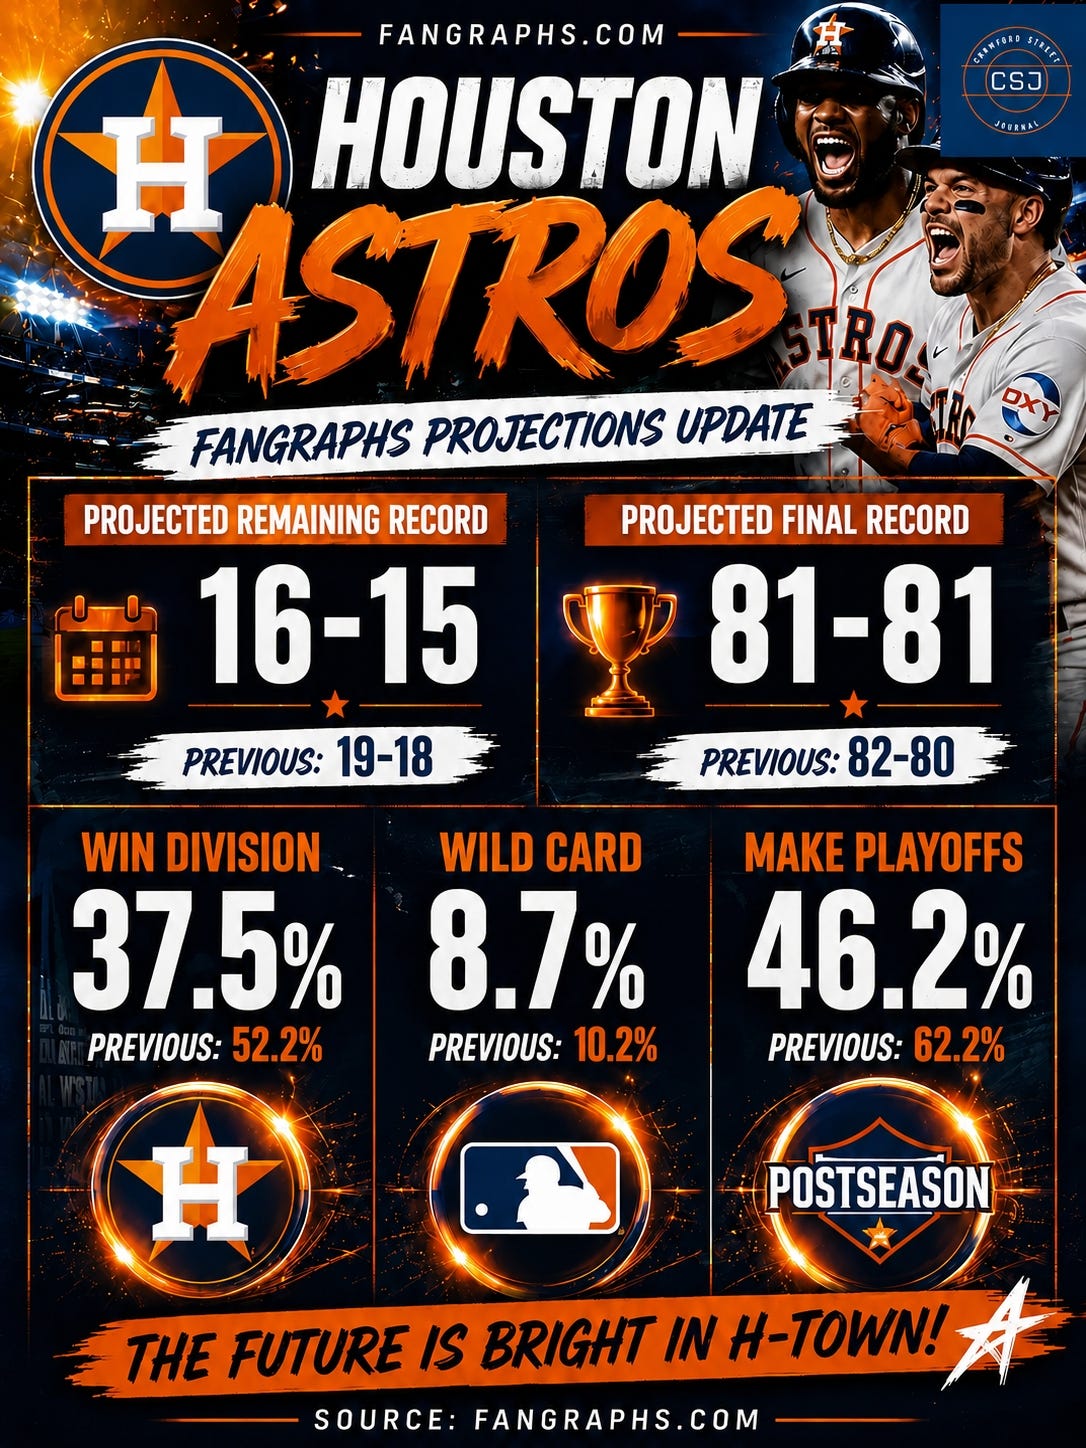
First, let’s take a look at what fangraphs.com says about a potential playoff run (through games of August 23):
Projected Remaining Record: 16-15 (Previous 19-18)
Projected Final Record: 81-81 (Previous 82-80)
Win Division: 37.5% (Previous 52.2%)
Wild Card: 8.7% (Previous 10.2%)
Make Playoffs: 46.2% (Previous 62.2%)
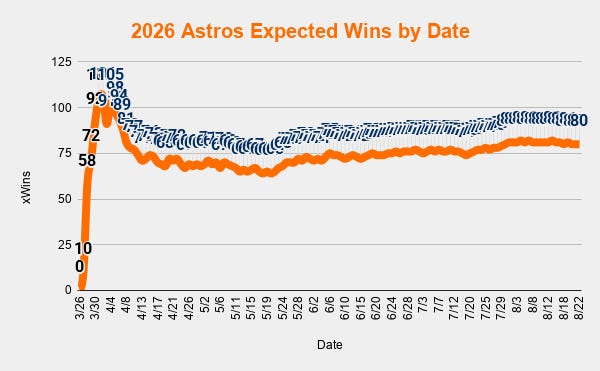
Expected Wins (as of August 23)
First, the big picture.
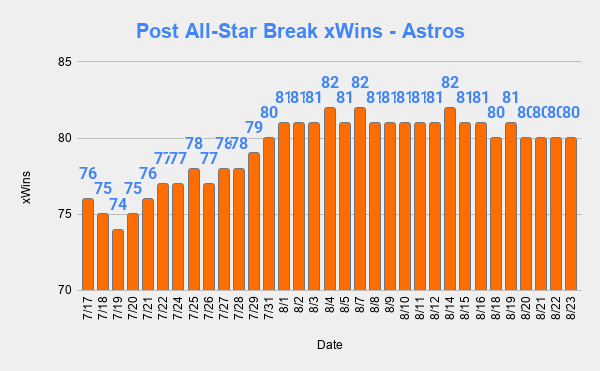
This chart tells you about the entire season, but it doesn’t tell you a whole lot about recency, because it’s 131 data points all jammed together.
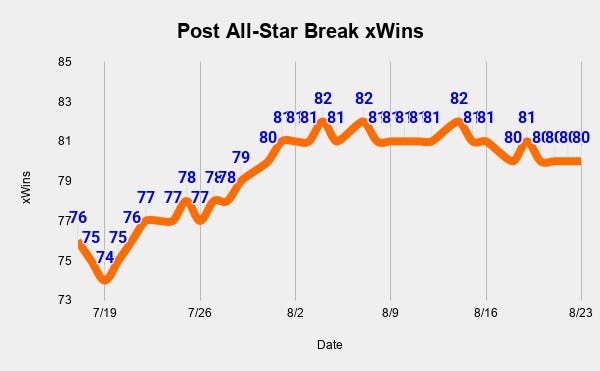
So, I created these two that start after the All-Star Break.
These two contain the same information, in a different format.
The important thing is, you can clearly see the Astros rise from a projected 76 wins to the current 80.

The AL West Race
So far, we’ve been looking at the Astros in a vacuum, without regard to any other team, but that’s not how this works.
Here is my traditional look at the AL West. What a division.
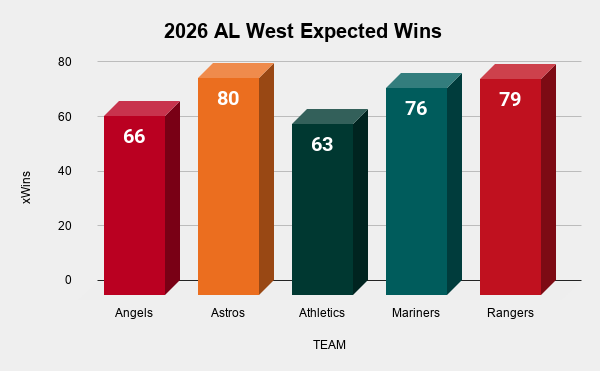
So, I’m projecting a 15-16 finish for Houston, not the 16-15 that Fangraphs projects.
I use a formula I created that blends the Pythagorean formula with actual wins and losses over the course of the season, weighting wins and losses more heavily as the season progresses.
When I do that to this point in the season, I get these results:
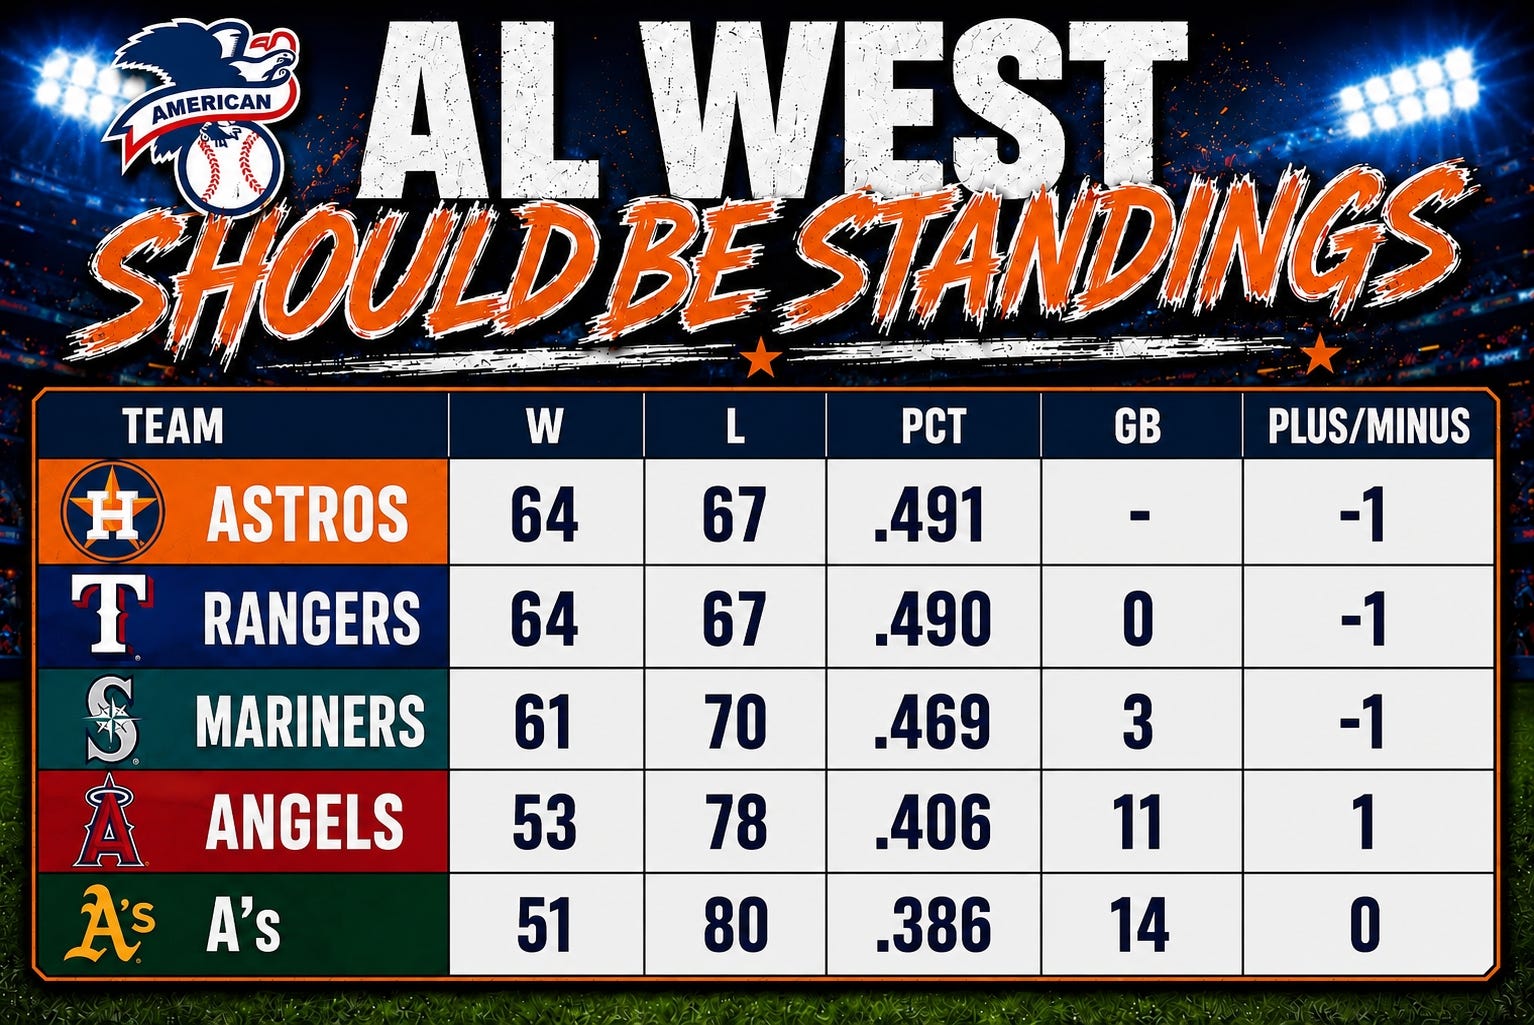
How to read these: My formula says the Astros “should be” 64-67 - they have overperformed by a game, as have the Rangers and Mariners.
The Plus/Minus column tells you these standings have 1 less win than the actual standings.
What this graphic also shows you is how close my formula correlates to the actual standings, with no team more than a game off the actual standings 125ish games into the season.
Using the PCT column above we can extrapolate the entire season to a final of:
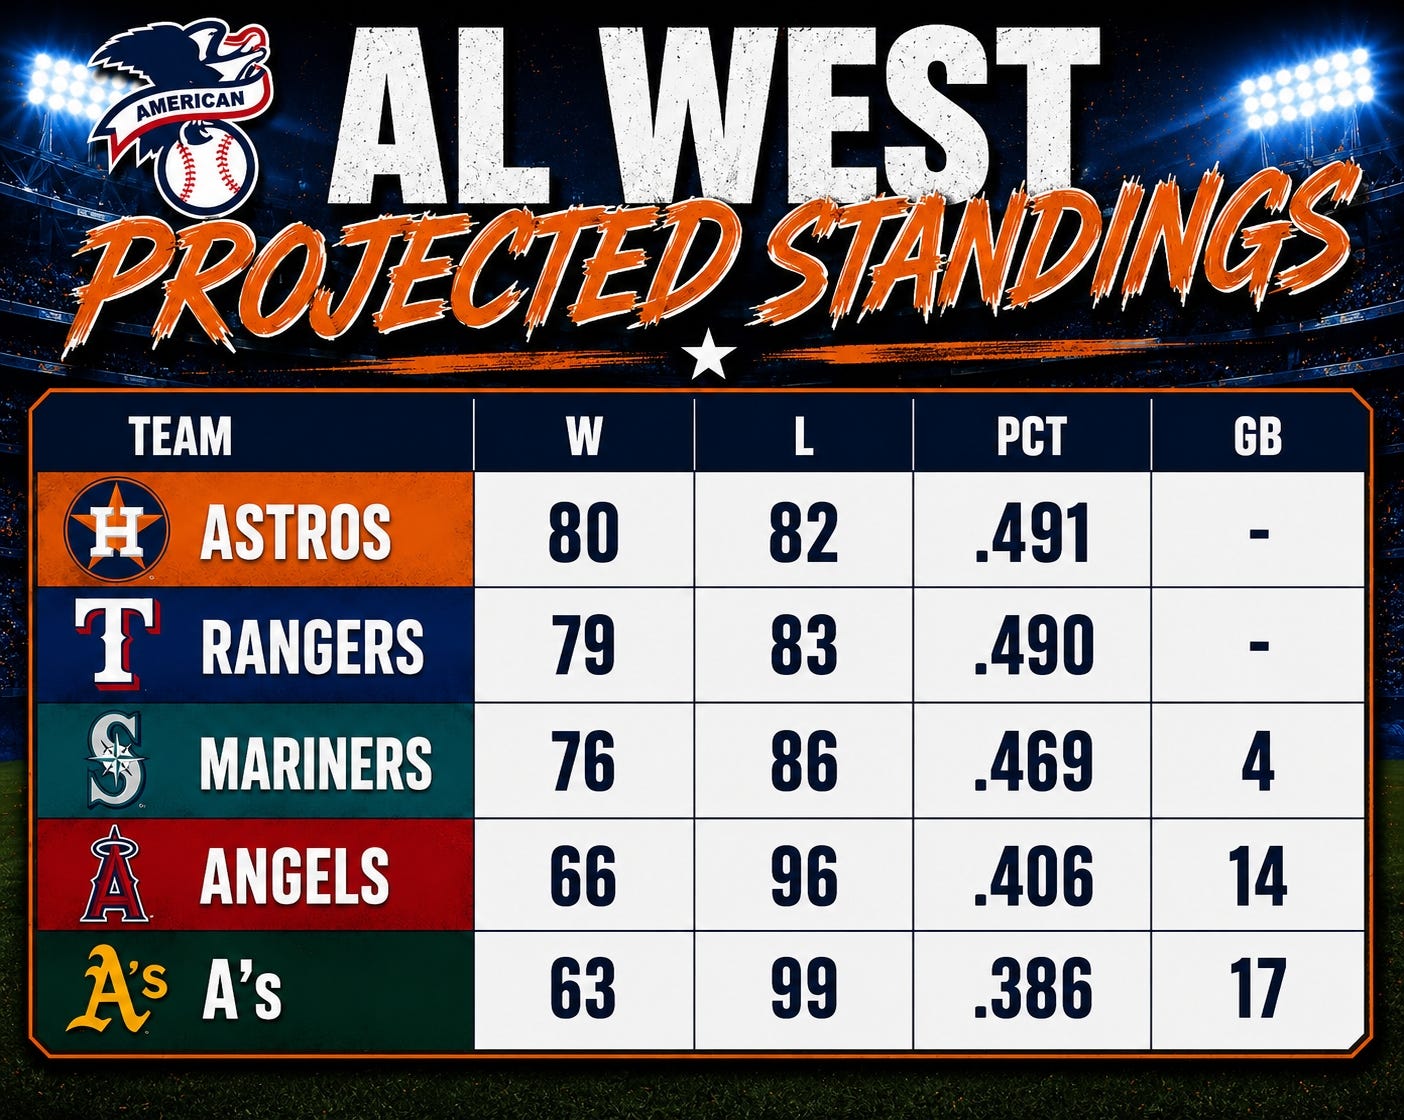
A note - the win totals are rounded. A .491 winning percentage = 79.542 wins. Obviously, the Astros won’t have 79.542 wins, so we round to the closest whole number, 80 in this case.
The Astros and Rangers have the same records, but the Astros run differential is +2 over the Rangers and that makes the difference here.
Basically, it’s a dead heat with a month to go.

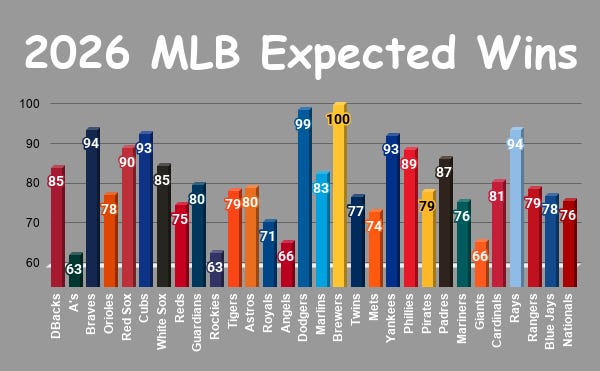
MLB Expected Wins (as of August 23)
Brewers and Dodgers leading the league.
Next Week’s Schedule
I hope to have a typical update tomorrow, but we’ll see.
I’ll be traveling a good bit next week, hitting Round Rock Tuesday, San Antonio Friday, and traveling on Saturday, so updates will be sporadic and likely shorter.
Thank you for your understanding!