

Bringing Us to Our Knees
Bats continue to struggle, scoring 4 runs in 3 games in St. Louis
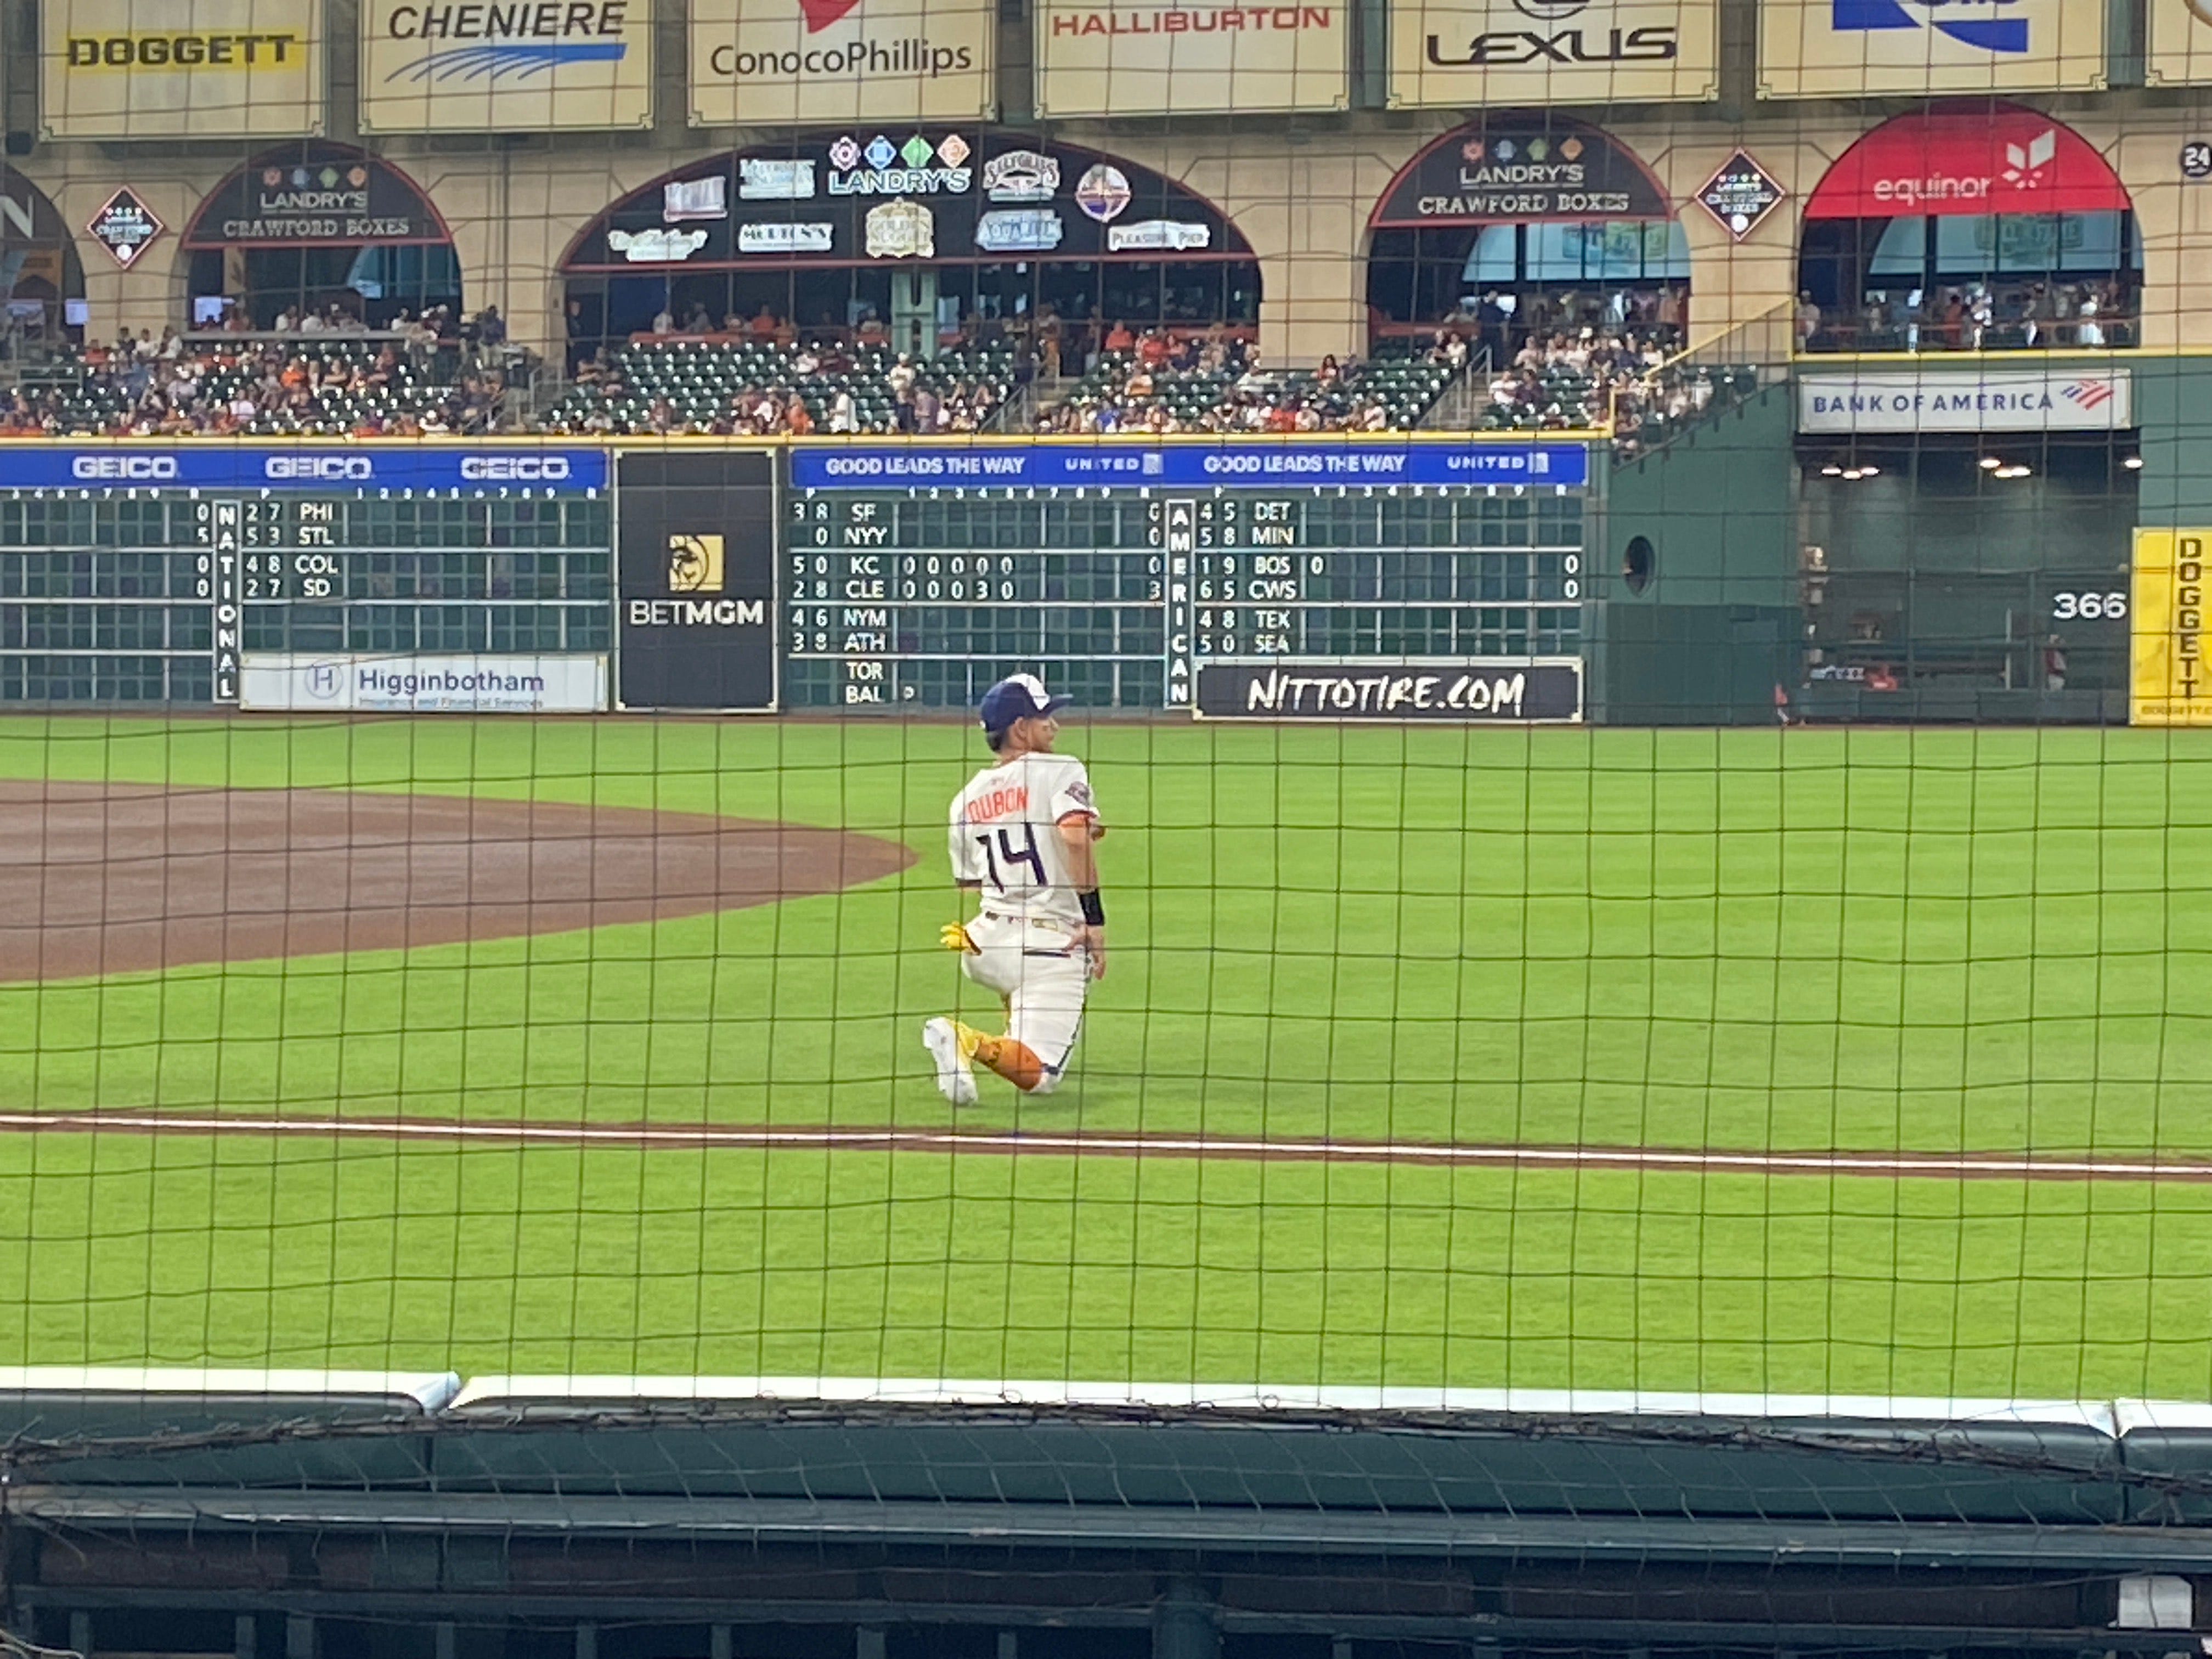
I was there Friday night and I saw it happen. I swear it did, but it seems like such a distant memory less than a week later.
That was the night the Astros’ offense clicked.
There were walks and base hits, home runs and a grand slam, even Cam Smith’s first career dinger.
But most of all, there were RUNS. 14 of them.
Or about 21% of Houston’s season total. In one game. In 8 innings.
Since then? 27 innings, 4 runs.
Astros Expected Wins
A quick reminder that even on days without a post, I typically update this graph under the Astros Expected Wins tab at the top of every page.

Updated Projections
One-ninth, or 11.1% through the season.
If Yainer hit his preseason projected .297 for the rest of the season he would finish at the .278 listed below.
For Yainer to average the preseason projected number of .297 he’d need to hit .341 (assuming 520 ABs) for the balance of the season.

Quality At-Bat Numbers
Team average is 40.7.

What counts as a quality at-bat? Different people have different definitions.
Some of the things I look for:
Hard Hit >= 95 MPH (though there is some discretion)
Base Hit, BB, HBP, SF, SAC, RBI
Advancing a runner
8+ pitch at-bat
Pitches per Plate Appearance

Base Running
With the caveat that it’s early and Altuve is a menace on the bases (both good and bad), early returns have the Astros improved.
They currently sit at 13th in the league and +0.2 as a team.

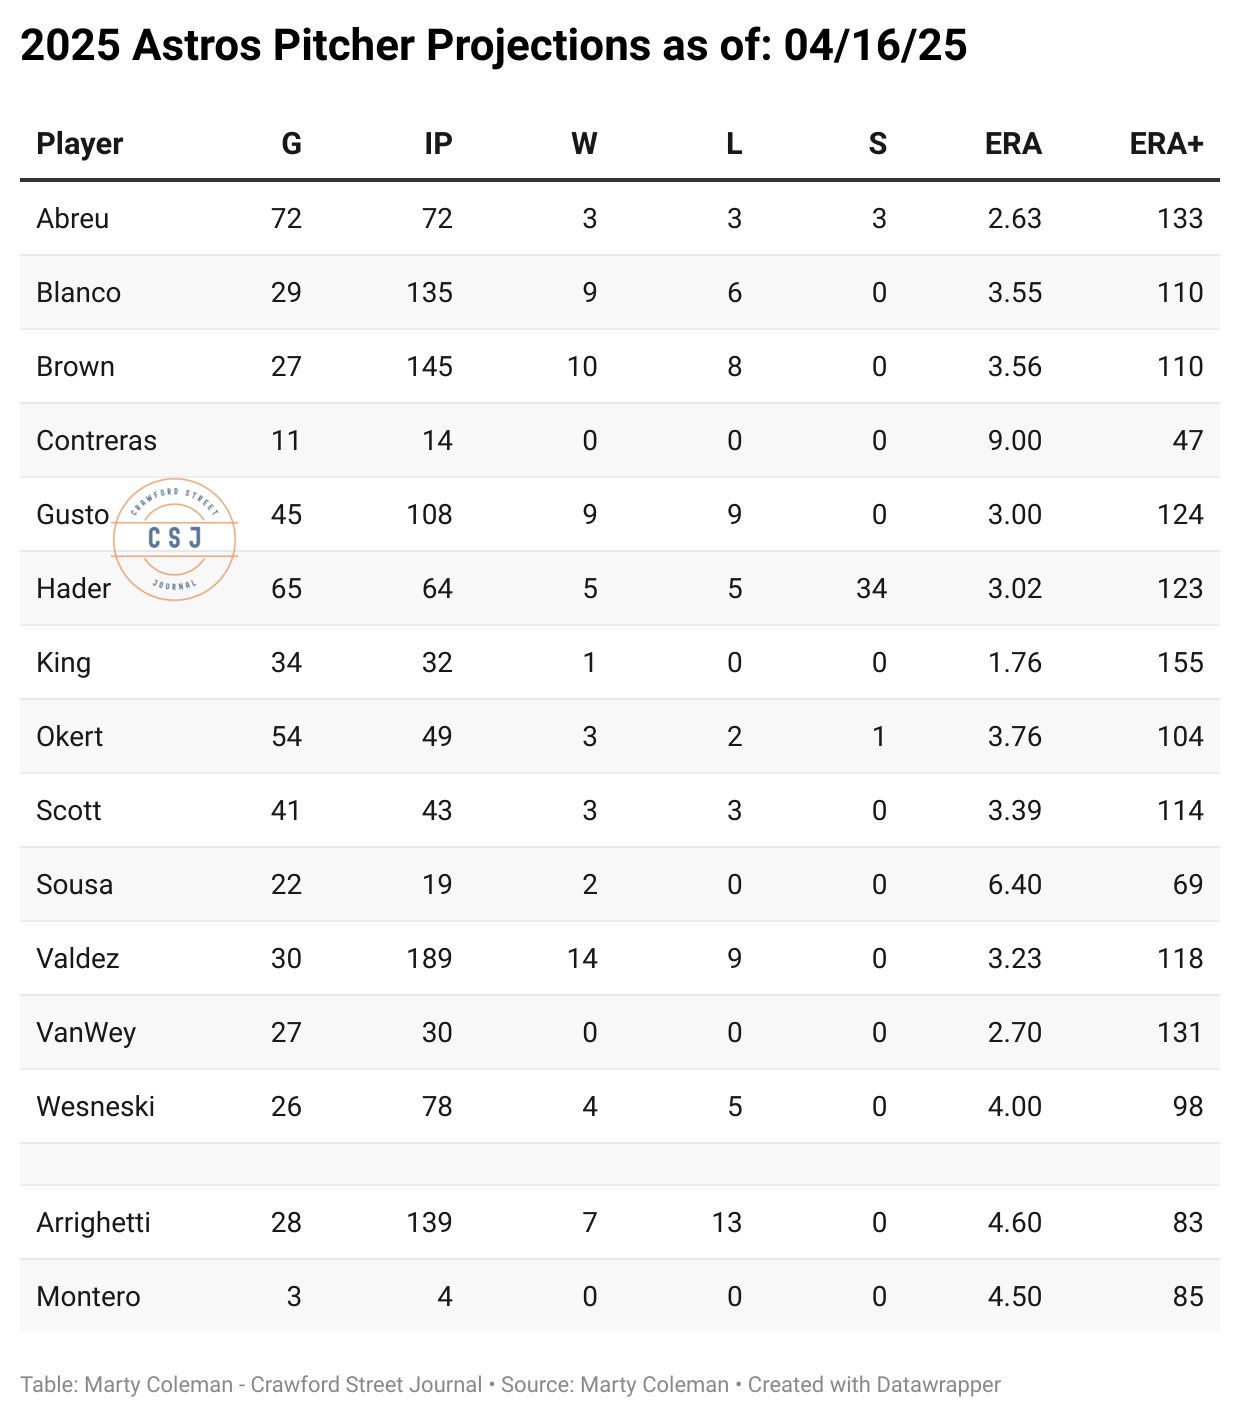
Detailed Pitching Stats
It’s taken some work to get it set up and I may adjust along the way, but this kind of thing offers something not typically seen.
QS = Quality Starts
KS = Kikuchi Starts
EI = Easy Inning, which is defined as 10 or less pitches
SDI = Shut Down Inning, which is holding a team scoreless the half inning after the Astros score.
PSDI = Number of Potential Shut Down Innings.
IO = Retired side In Order.
This information is instructive for me, particularly the Easy Inning (EI%) and In Order (IO%).
It highlights that Blanco is not having easy innings and not retiring the side in order very often, which of course leads to fatigue and runners on base.

Fangraphs uses version 2 of the Game Score metric and that’s what I’ll be using here.
Of note is that these change in retrospect, based on the constant used in the formula which is designed to keep the league average at 50.
I will update periodically.

On to the bullpen.
Still working through the kinks here.
A quick reminder these are “Opportunities”, not appearances.
What strikes me here is that Bryan Abreu has not retired the side in order in any of his 8 opportunities.

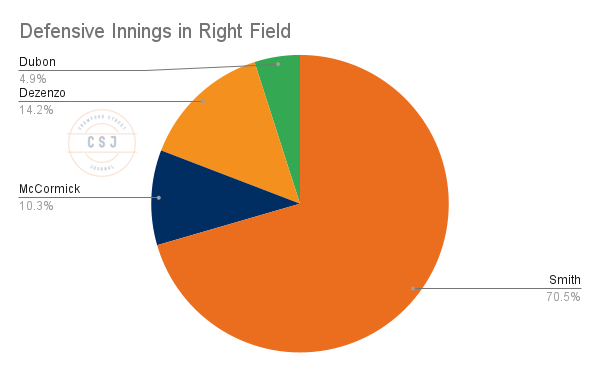
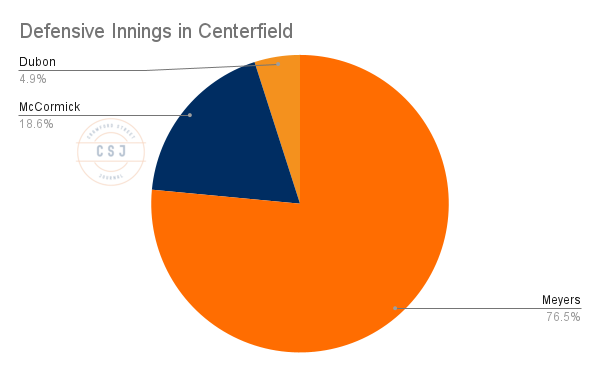
Playing Time Breakdown
Second base and the outfield has been a mix and match.
Here’s the break down.
Rodgers sore hip opened up some playing time for Dubon, but Rodgers was back in the lineup yesterday.


While Jose Altuve has the majority of time in left, the Astros have used 5 different left-fielders in 18 games.


Cam Smith has taken over the majority of innings and at-bats for right fielders as he has struck out less recently.

Jake has hit and played really good defense early in the season, earning the majority of time in center.

Rando Stats of the Day
The Astros are 23rd in average exit velocity, but 13th in Hard Hit%.
Isaac Paredes has 1 barrel through 18 games.
The Astros team batting average of .216 is 25 points below their xBA of .241.
The Astros wOBA (.280, 26th in the league) is 34 points below their xwOBA of .314. .314 would rank the Astros 14th in MLB in wOBA.
Jose Altuve is 2 OAA in left field, ranking in the 88th percentile.
As always, thanks for reading and I hope to have an additional post tomorrow!