

Back Home in H-Town
Astros take on Angels for three
That last one in Seattle was tough, but it comes with the territory.
The territory being pinching pennies in the bullpen.
Even with that it took an extraordinary gaffe by Joe Espada to give Seattle hope, which the Mariners parlayed into a series win.
Such is life as an MLB mid.
Updated Projections
7.4% of the way through the season and we’re beginning to see some drag on the hitters that aren’t seeing results, such as Walker and Diaz.
Walker’s peripherals still look pretty good: Exit Velocity (74th percentile), Barrel% (77th), HardHit% (89th) and Bat Speed (85th) are all in the red.
Yainer’s batting numbers contain 0 red. Zero. Zip. Zilch.

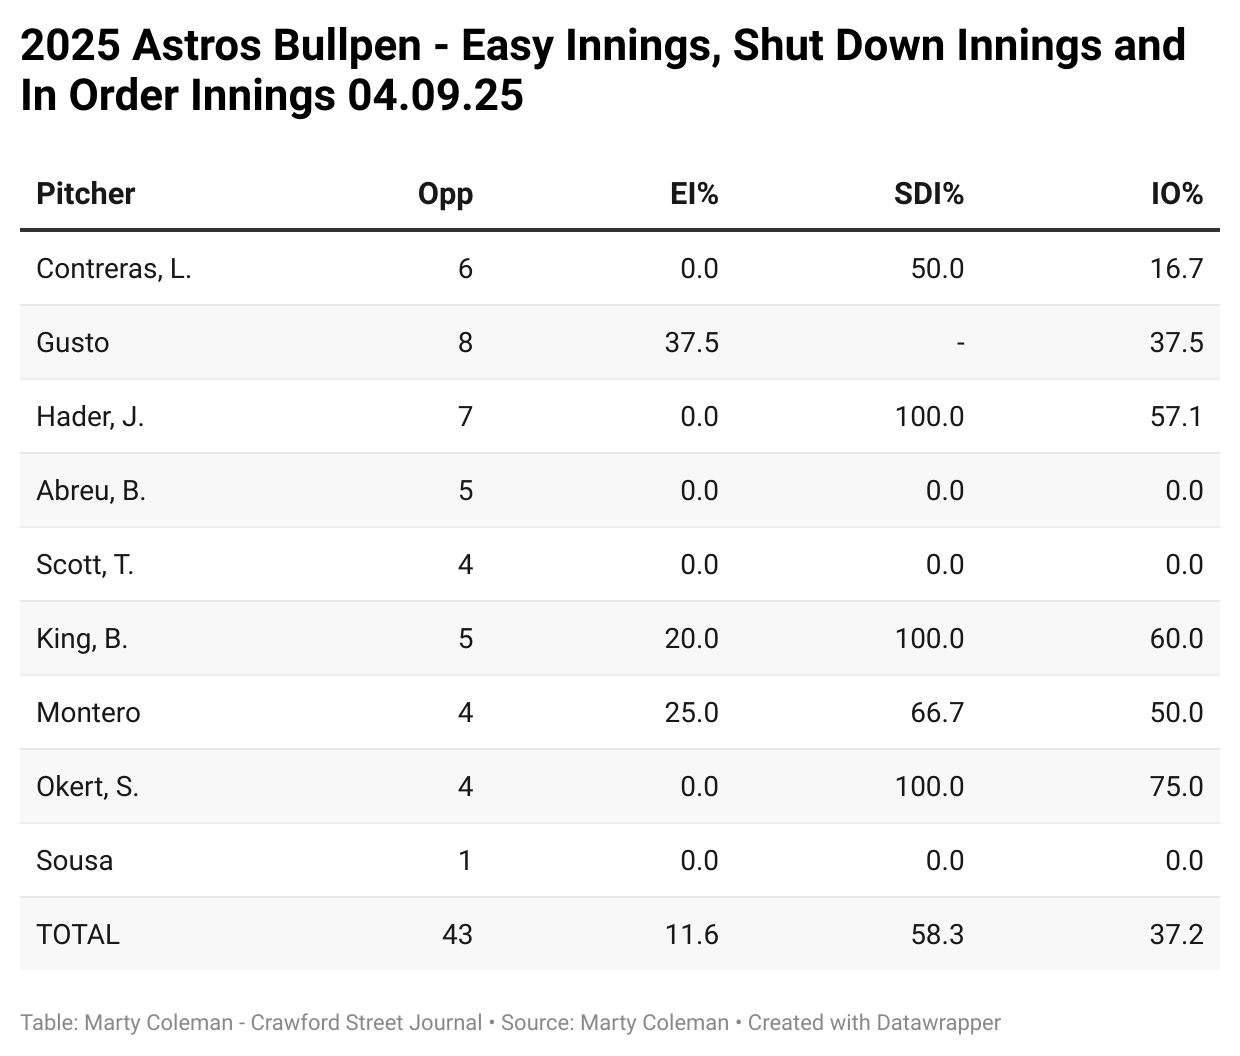
Hunter Brown is performing much better than his current projections, and Bryan King continues to mow down the opposition.
Ryan Gusto will get his first MLB start on Saturday and I’ll be in attendance (will be there Friday, too).
Gusto has been very good out of the pen, but if and how that changes when he starts will be a fascinating watch.
What an outing by Hayden Wesneski last time out. I’ll have more on Wesneski in the coming days, before his next scheduled start on Sunday.
Obviously, Arrighetti’s number will decrement during his absence and Montero’s will be static.

Astros Expected Wins
Not much movement either way, with three one-run games in Seattle.

Quality At-Bat Numbers
Team average is 40.7%, meaning the drag is Meyers and below, despite Jake’s solid series in Seattle.

What counts as a quality at-bat? Different people have different definitions.
Some of the things I look for:
Hard Hit >= 95 MPH
Base Hit
BB
HBP
SF
SAC
Advancing a runner
8+ pitch at-bat
RBI
Pitches per Plate Appearance
Yordan continues to lead the way, with Paredes right on his heels.

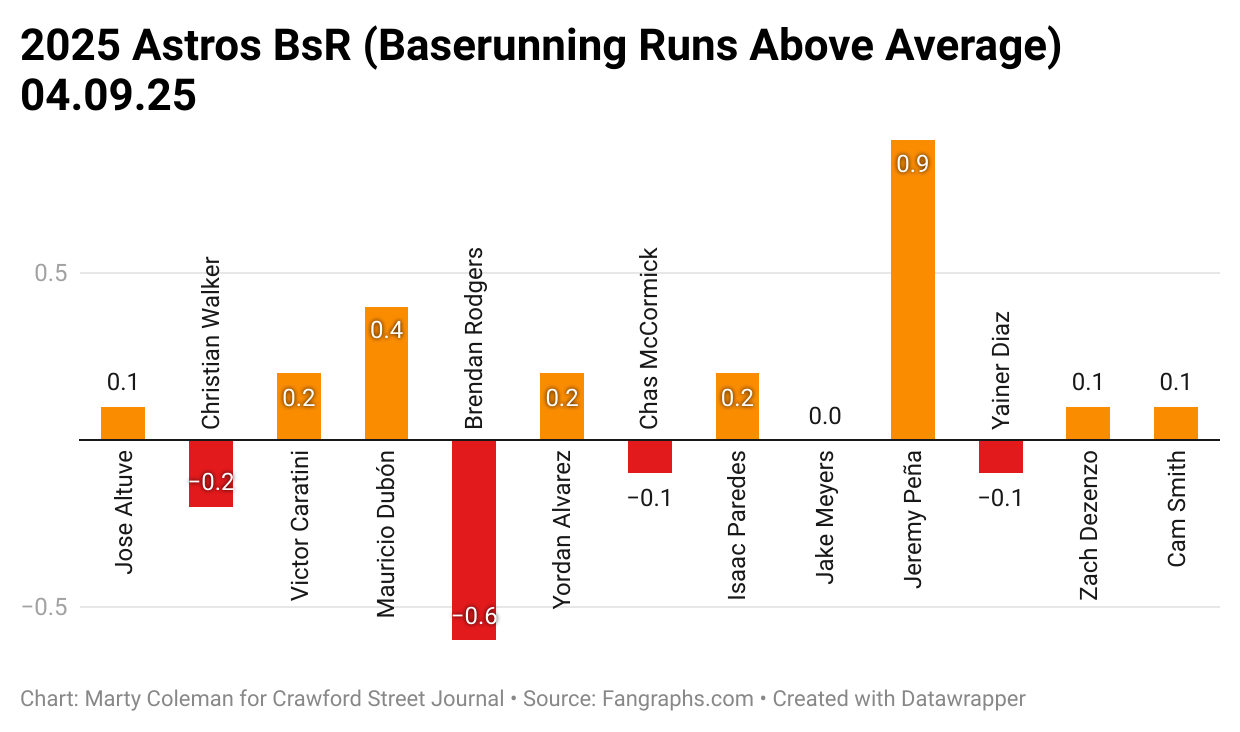
Base Running
More positive than negative and as a team the Astros are +1.4, which is good enough for 6th in MLB.
I should say the same thing as when the numbers are bad early in the season - it’s early - but this is a big improvement over last season so far.
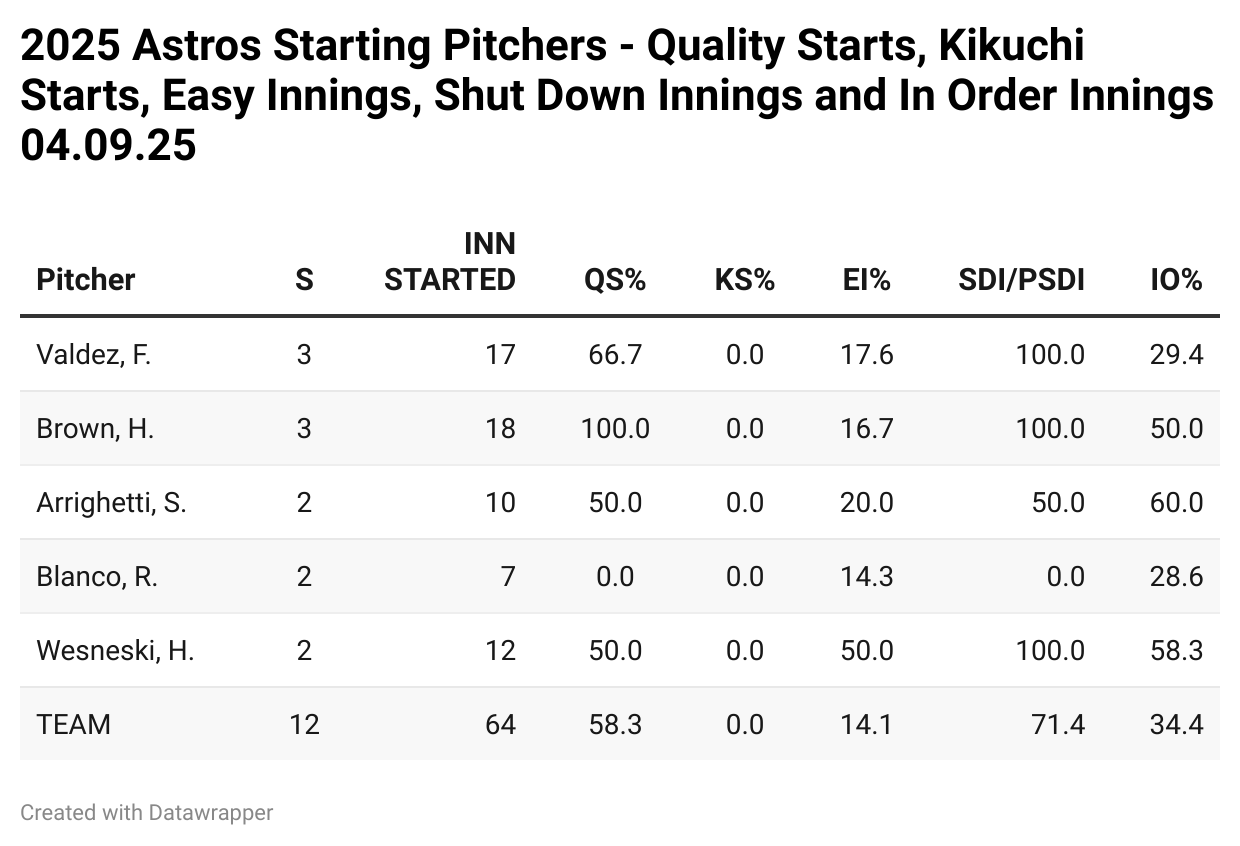
Detailed Pitching Stats
It’s taken some work to get it set up and I may adjust along the way, but this kind of thing offers something not typically seen.
QS = Quality Starts
KS = Kikuchi Starts
EI = Easy Inning, which is defined as 10 or less pitches
SDI = Shut Down Inning, which is holding a team scoreless the half inning after the Astros score.
PSDI = Number of Potential Shut Down Innings.
IO = Retired side In Order.
Brown’s numbers are outstanding.
Consider - 3 for 3 on quality starts, 16.7% of time he has an “Easy Inning” (10 pitches or less), he has shut down the opponents 100% of the time when the Astros score and 50% of the time he has put the oppo down in order.
Fangraphs uses version 2 of the Game Score metric and that’s what I’ll be using here.
Of note is that these change in retrospect, based on the constant used in the formula which is designed to keep the league average at 50.
I will update periodically.

On to the bullpen.
Still working through the kinks here.
Perhaps recency bias, but I think this is going to be a struggle the entire season.
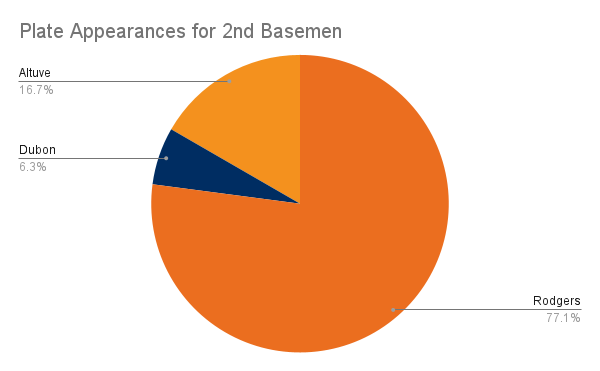
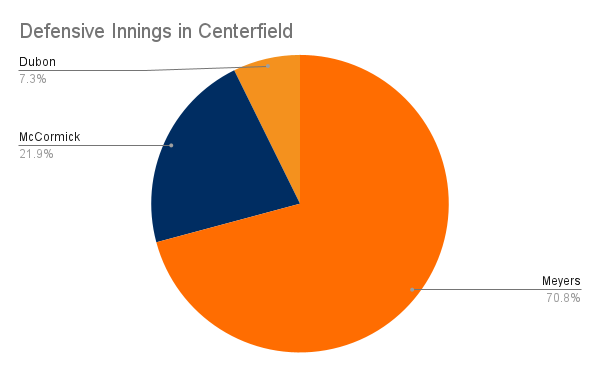
Playing Time Breakdown
Second base and the outfield has been a mix and match.
Here’s the break down.


Rando Stats of the Day
Yainer Diaz has 2 barrels and 9 hard-hit balls (over 95 MPH) in 36 plate appearances, but has the second-highest O-Swing % on the team at 42.7%.
That 42.7% is lower than Diaz’s O-Swing% of 45.7% in 2024, when he hit .299.
Only Zach Dezenzo has a higher O-Swing rate (45.0%).
Hunter Brown has averaged 97.5 MPH (per Fangraphs) on his four-seam fastball after averaging 96.1 MPH last season.
Can he maintain that through the season? Good question.
Dating back to May 22, 2024 Brown has a 2.27 ERA over 25 starts.
As always, thanks for reading!