

Expected Wins - A Better Way
2025 Expected Wins give us a starting point for projecting 2026

Not all of the formulas and calculations I share are perfect and some are far from it.
I constantly test ideas/hypotheses in the background and eventually share them if I believe they add to the general knowledge.
There are plenty that are never published and some are published and subsequently discarded.
There are several I fully believe in and one I’m supremely confident in.
Each day during the regular season, I provide the expected wins for the Astros and (sometimes) the AL West as a whole and I typically post these with the stat updates.
The Astros expected wins are posted daily, whether there is a general post or not.
In the background, I also keep these numbers for the entire league, which I generally don’t publish because of a perceived lack of interest on an Astros-focused site.
A drawback of the way I calculate these is that it’s not forward-looking, but rather applies what has happened up to that point in the season and assumes the team will continue performing at the same level.
That rarely, if ever, happens.
By the way, the famous Pythagorean Winning Percentage does the same thing - it does not include a magic formula with injury adjustments, luck or any other input, but simply looks at runs scored and runs allowed and applies a formula (more on that in a minute) and comes with a win percentage, which it multiplies by 162 to come up with expected wins.
The formula I’ve developed takes this a step further by including actual wins and losses, because once you lose a game, it’s your record no matter how much you outscore your opponents by in future games.
A simple example in a three-game series:
You lose game one 1-0, win game two 12-1 and win game three 9-0. You have outscored your opponent 21-2 and are 2-1.
The Pythagorean formula would calculate (using 1.81 as the exponent) an expected record of 3-0, or more precisely 2.96-0.04, which rounds to 3-0.
My “blended” formula, which includes a weight assigned to the losses, calculates the expected wins at 2.22-0.78, much closer to the actual record of 2-1.
Over the course of 162 games, this makes a difference, and it also makes my formula much more accurate.
How much?
Below is a table of the 2025 regular season wins for each team, the number of expected wins based on the Pythagorean Win Expectancy (using the 1.81 exponent), the difference between those two and then the same thing using my expected wins.
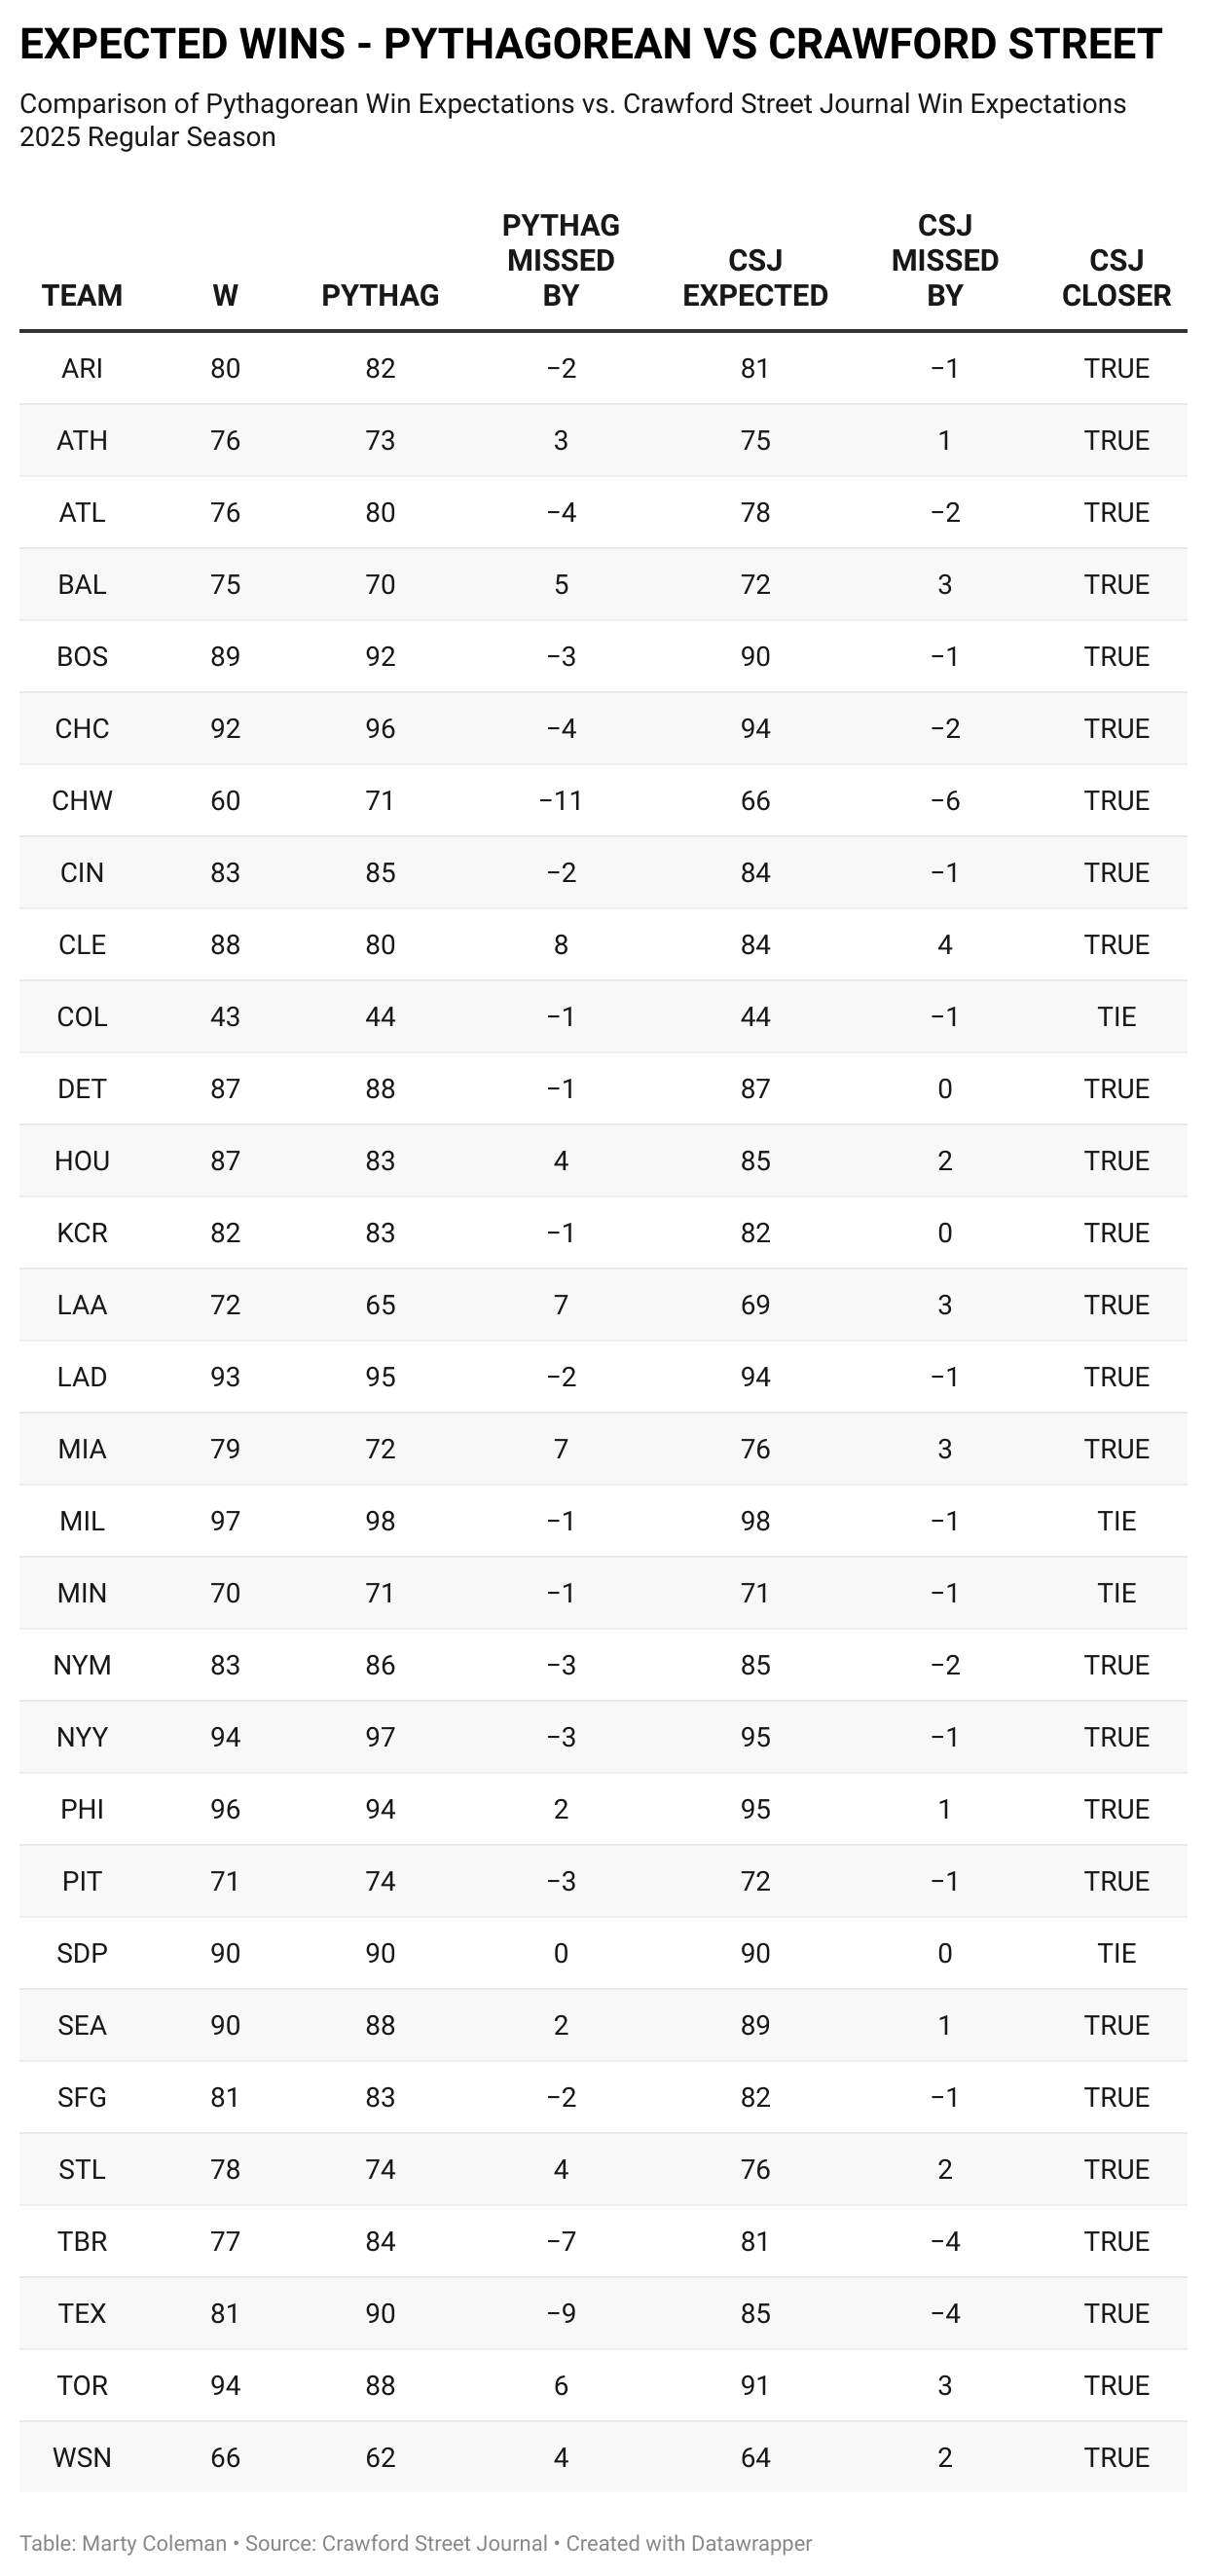
Crawford Street Journal’s formula was closer on 26 of the 30 teams and the other 4 were equal.
In addition, taking the absolute difference from each team shows that, in total, the Pythagorean Win Expectancy was off by 109 games over the 30 teams, where my formula was off by a total of 54 games, meaning my formula has slightly less than half the error.
On average, the Pythagorean Formula was off by 3.63 games, while the Crawford Street Formula was off by 1.8 games.
I use this information in more ways than just expected wins for the current season.
For example, this gives me a head start on who may be better next season (pending roster moves, injuries, etc), look for teams with the negative numbers like the White Sox, Texas and Tampa.
The reverse is also true. Higher positive numbers mean a team likely overperformed: Cleveland, Miami, the Angels and Toronto.
In a coming post, I will argue that despite their failure to make the playoffs and the disappointment that caused, the Astros “overperformed” in 2025.
Thanks for reading!