MLB Luck Rankings
Methodology
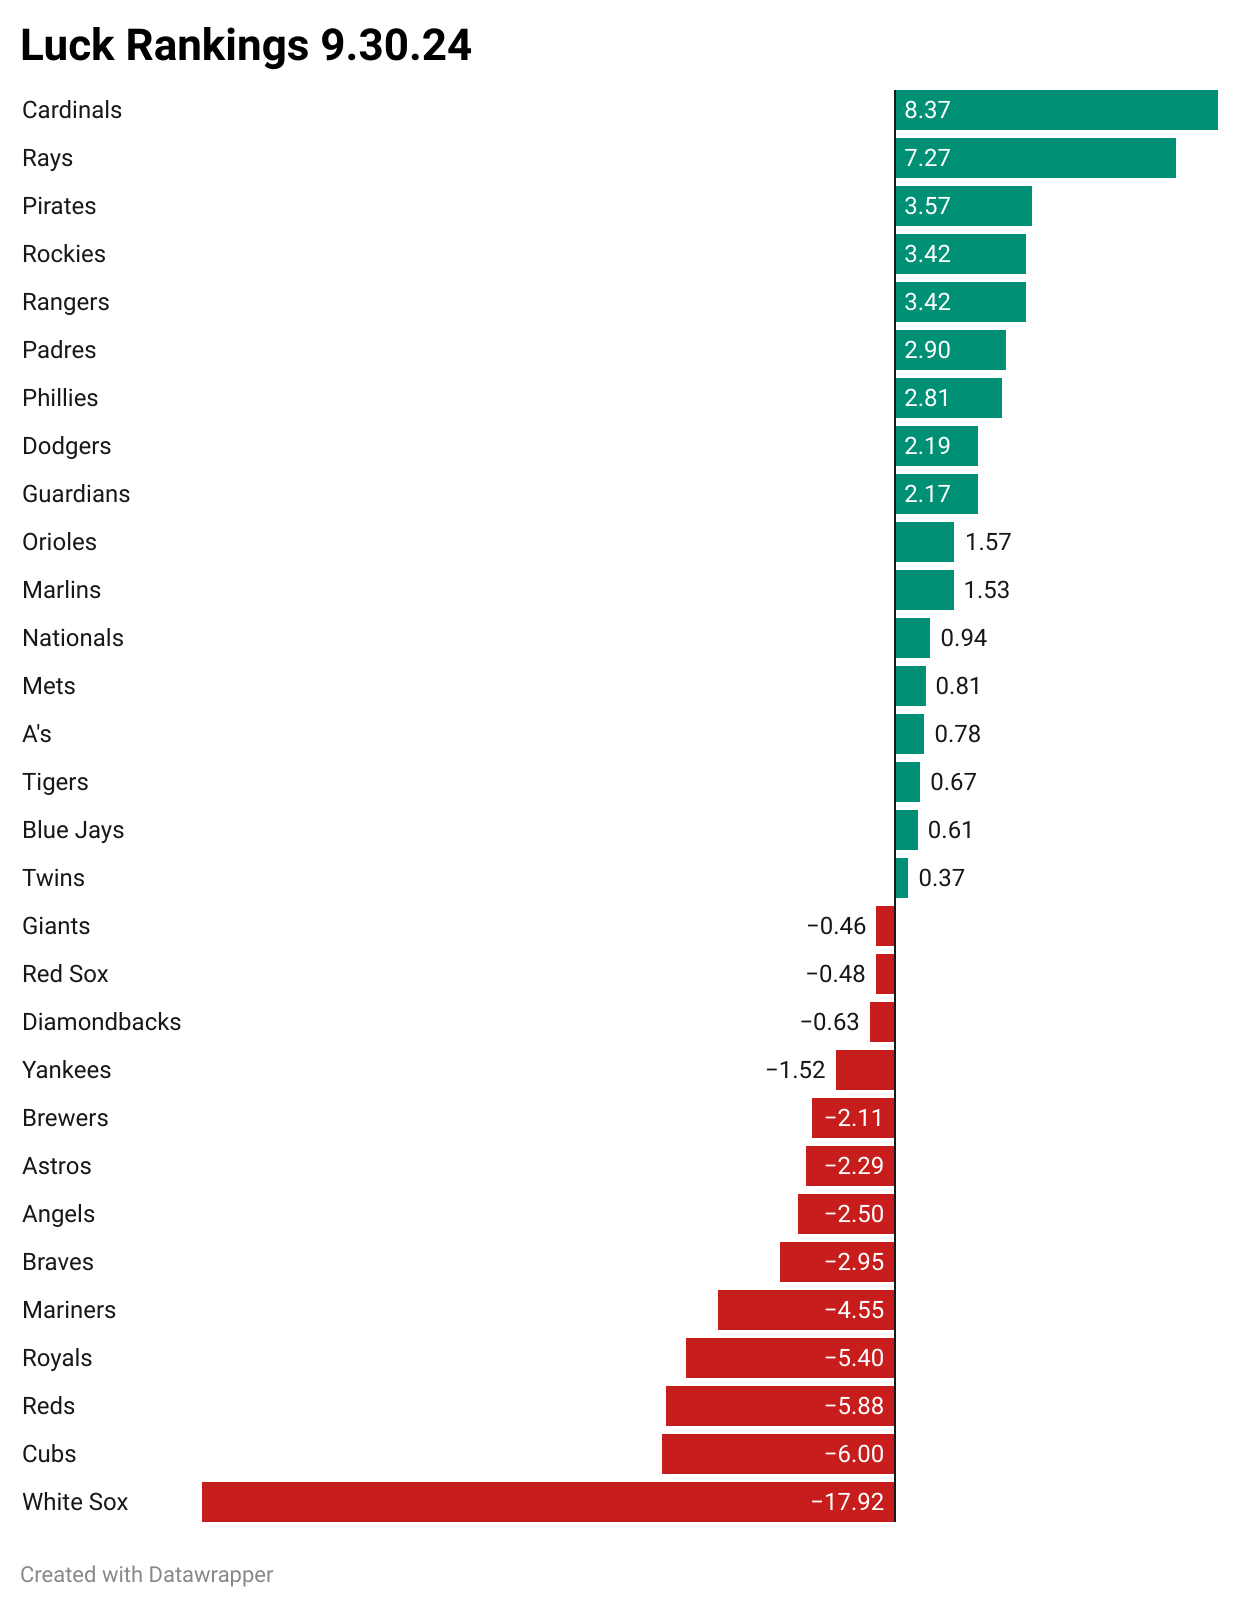
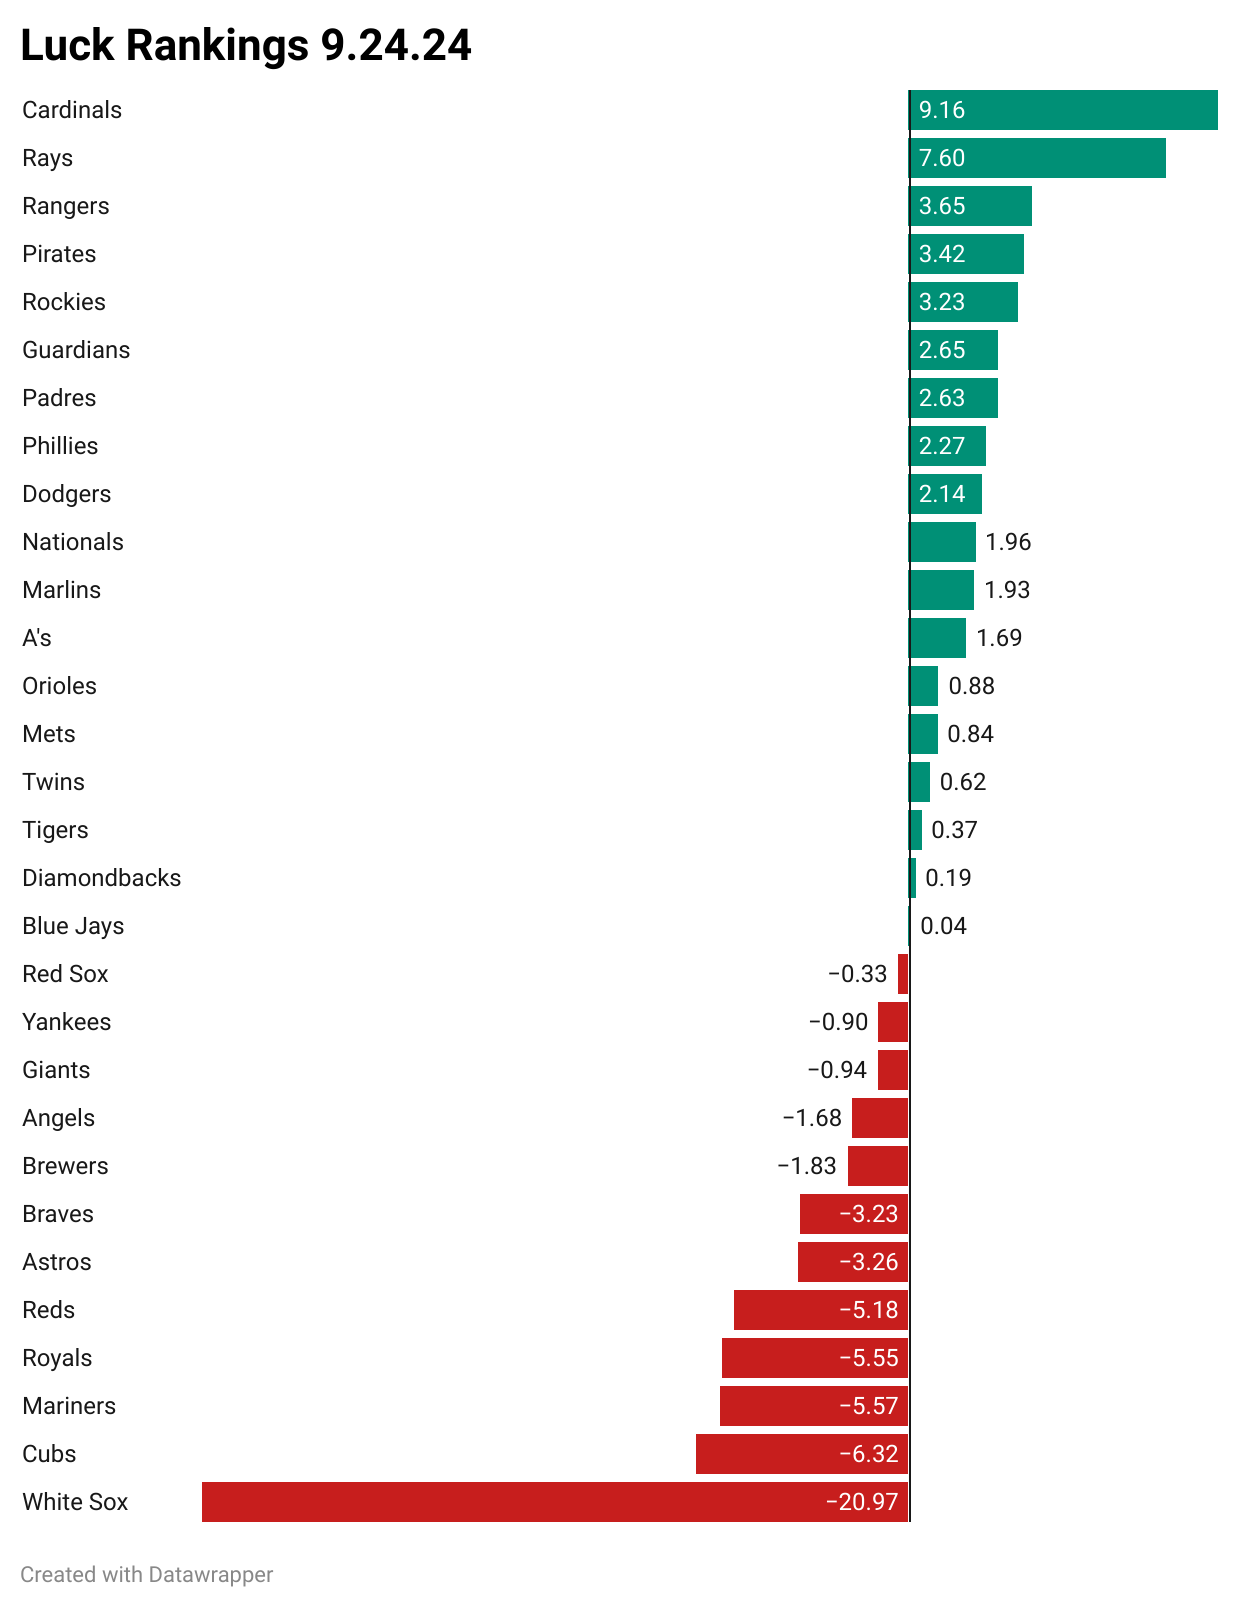
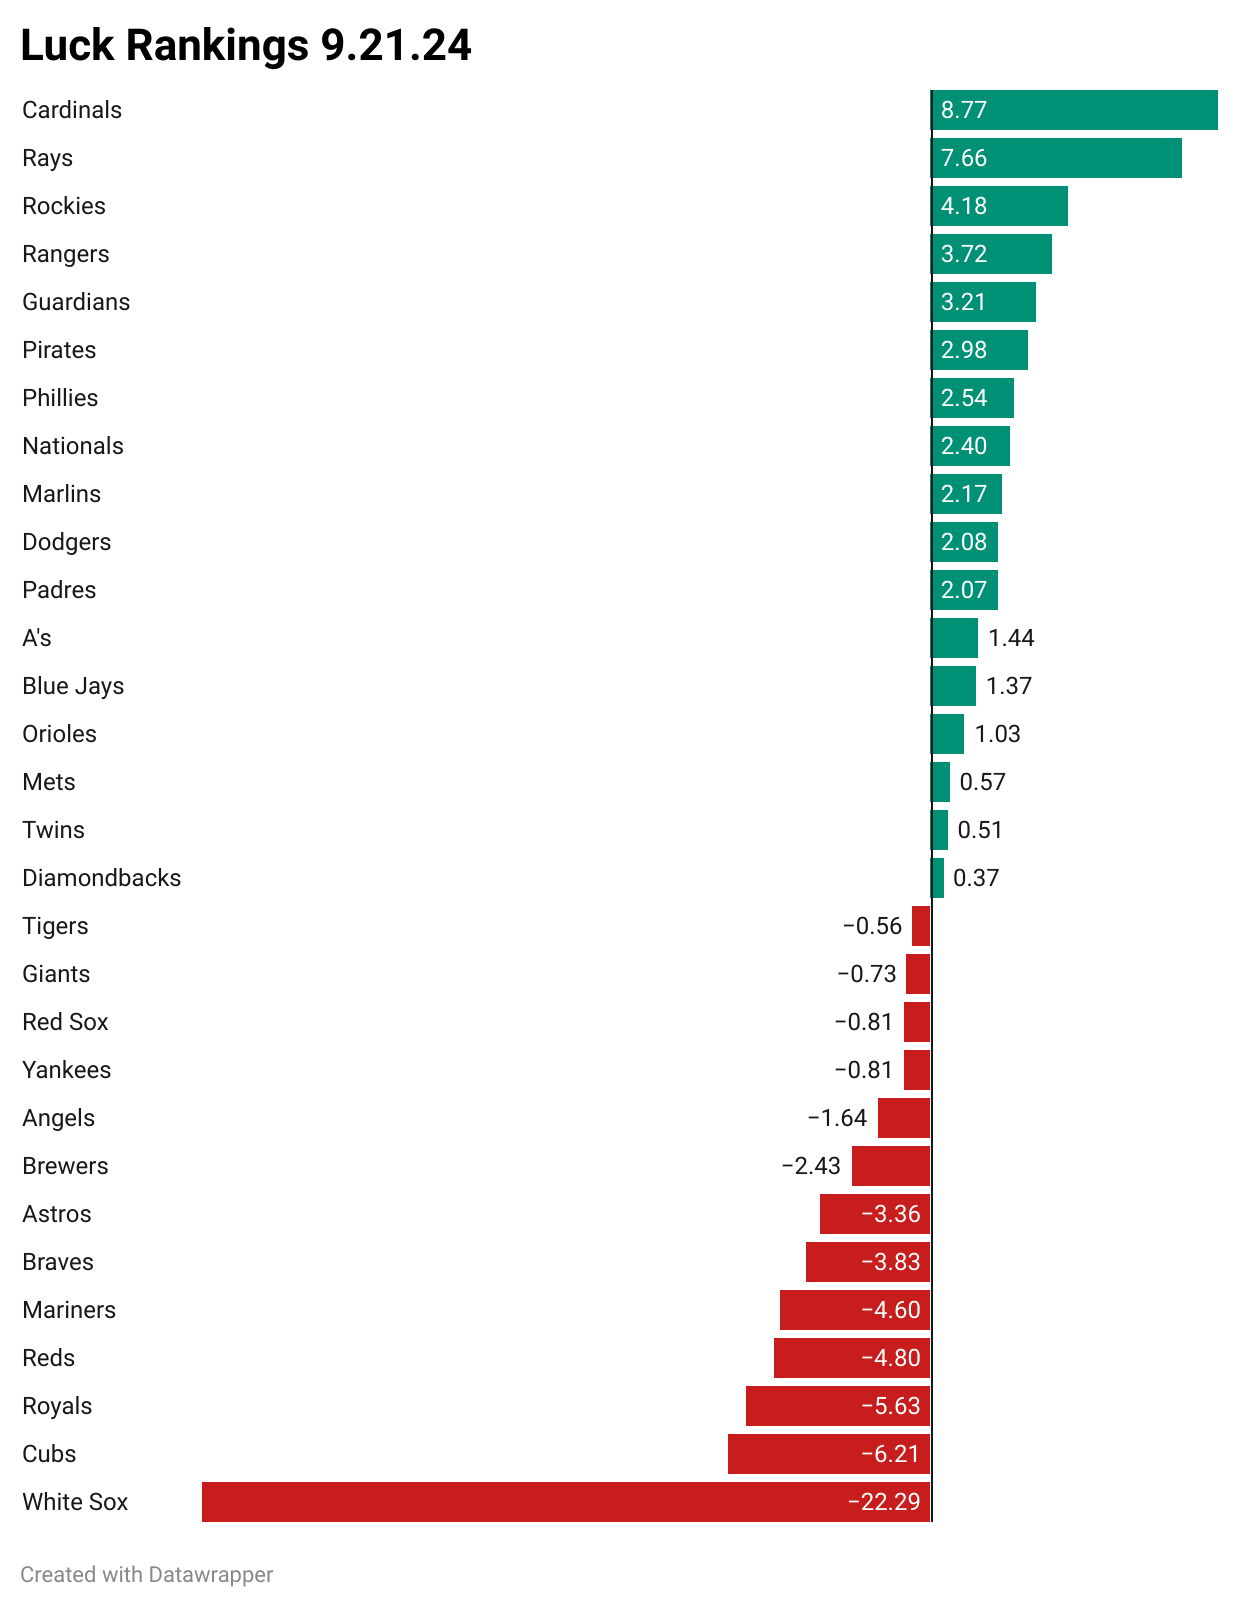
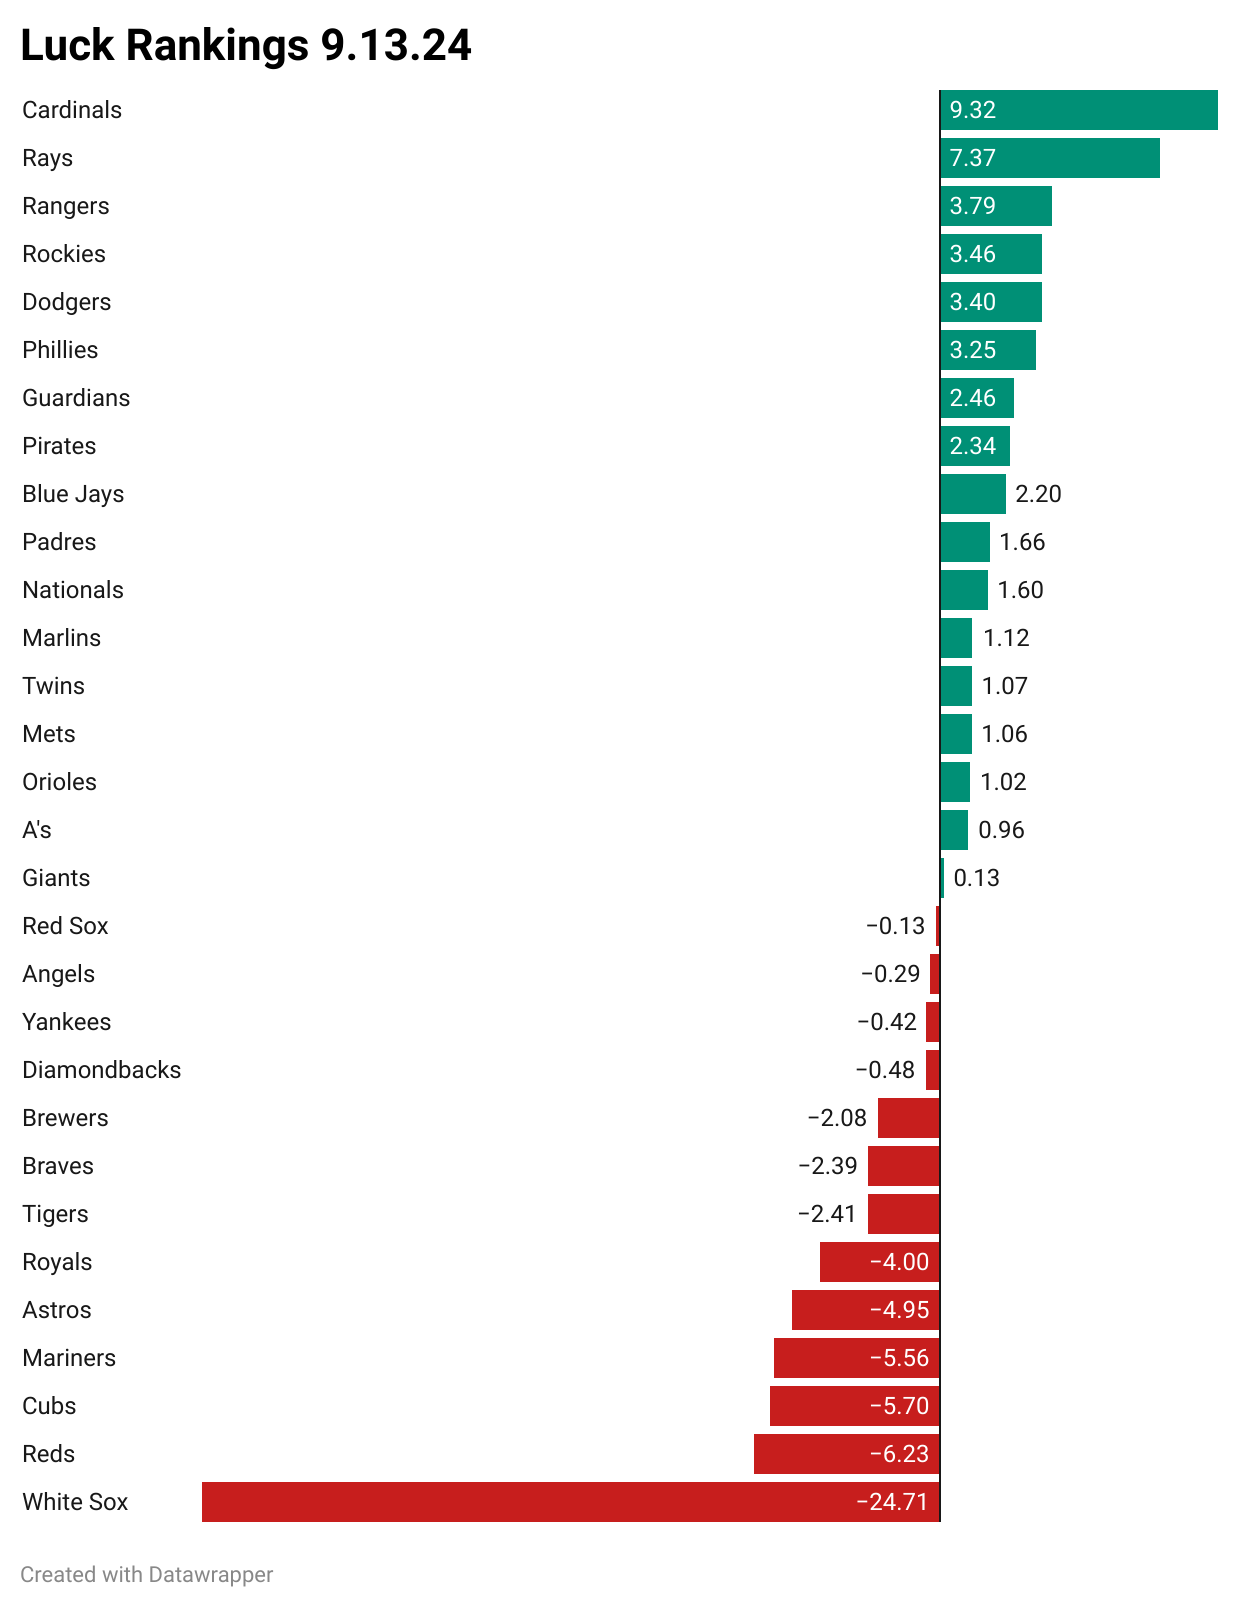
Teams at top are “luckiest”, teams at bottom are “unluckiest”.
The number assigned is the percentage of a team’s winning percentage that can be attributed to “luck”, either positive (green) or negative (red).
Example: At one point the Astros win % was .439 and my numbers say they “should” have been at .493, a difference of .054.
.054/.439 = 12.3% (rounded), which was the Astros luck rating, which was negative in this example.
In general, you expect the teams at bottom to regress positively (towards 0.00) and teams at top to regress negatively (to 0.00).


