

On to Beantown
The Astros drop another series to start road trip, now travel to Boston for 3
There were a lot of positives from Thursday’s second game, but the totality of the series was not what the Astros needed.
Winning 1 of 3 isn’t going to cut it.

The Astros 12-20 record leaves them tied for last in the AL West, 5.5 games behind the Athletics.
But it’s a new month and a new series, which brings new opportunities and maybe some new hope.
Updated Projections
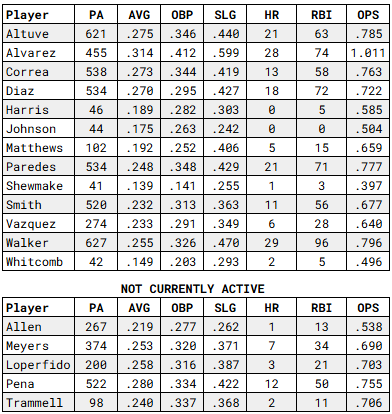
We are now 19.8% of the way through the season and Yordan and Christian Walker continue to rake.
More on Yordan shortly.
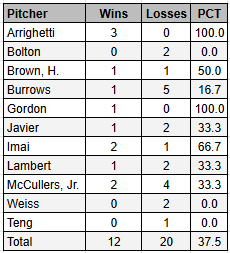
Record by Starting Pitcher
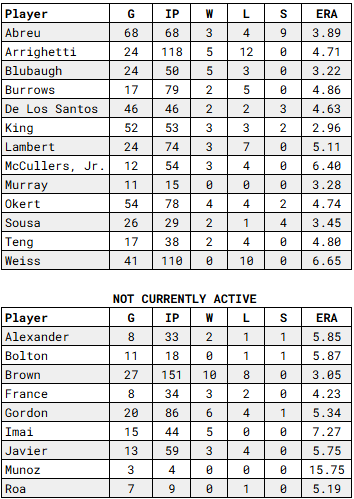
Decent starting pitching in both games of the doubleheader for Lambert and McCullers, Jr.
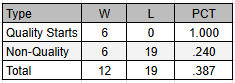
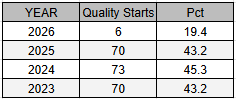
Quality Starts
The trend continues, but is unlikely to persist all season. My research has shown that about 70% of the time, if a team gets a quality start, that team will win the game.
It’s not rocket science, especially when a team can score like this one does.
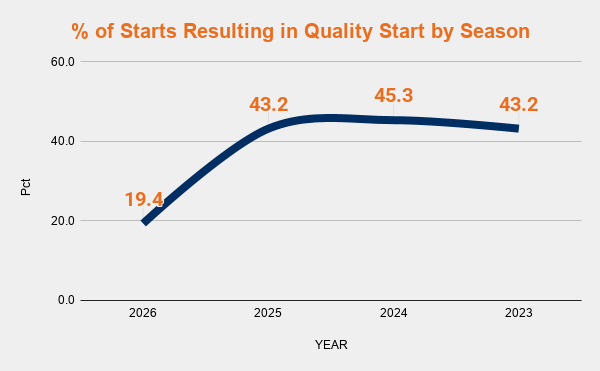

Game Scores
Arrighetti leads the active starters.
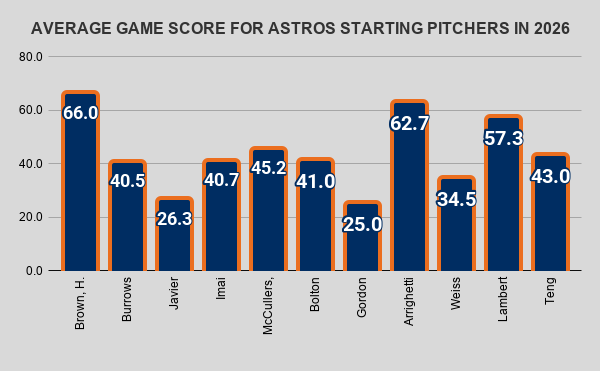
Realizing those numbers may not mean much to some readers, I’m attempting to present them in a format that is easier to understand.
So, I’ve taken the scores and converted them into letter grades, as you’d get in school.
This is a work in progress, not a final output, as you’re seeing me work through it in real time.
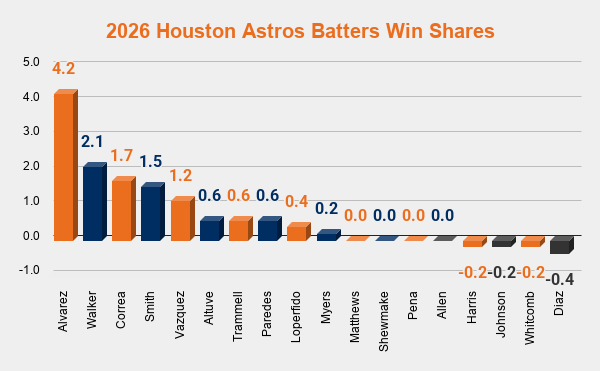
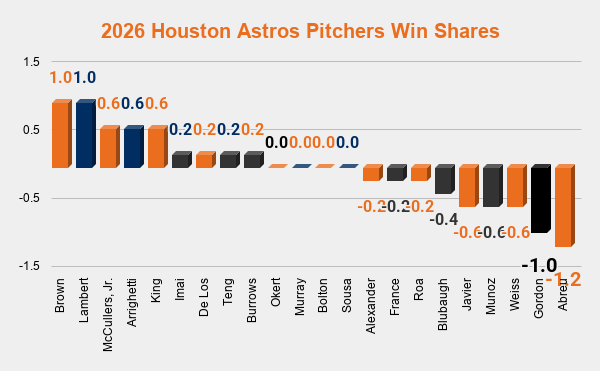
Win Shares (not fWAR)
Add all these together, and you get a net of 12, which is the number of wins the Astros currently have.
Yordan continues to pace the field, with Christian Walker gaining and Correa making a push.
Batters have combined for 6.3 fWAR, while the putrid pitching staff is at -0.1.
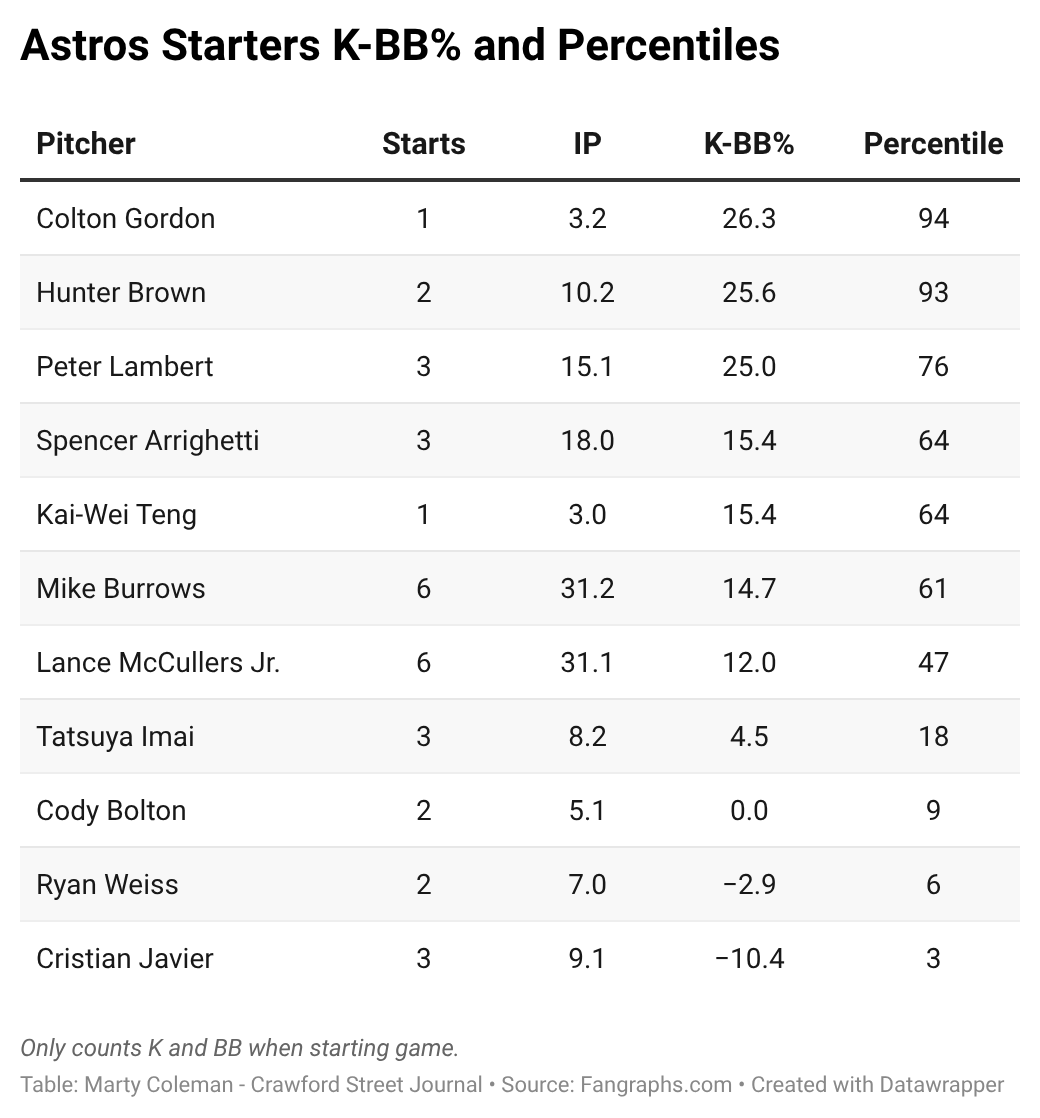
K-BB% Percentiles
I’ve heard a lot about this metric, particularly that it is a better predictor of success than ERA.
These are the Astros starters and their percentile rankings in this metric.
It’s still early, but here is the general scale:
Elite: 15-20%
Solid/Above Average: 12-15%
Average: 11-13%
Poor: Below 10%
As of this writing, the league average is 13.1% (for starters).
Then and Now
A new periodic segment comparing preseason projections to current projections to see how we are doing.
I did this with Christian Walker last time, and I enjoyed seeing how the actual results affected my projections.
Here’s Yordan, and it looks like I am going to miss this one by a mile, and I am thrilled about it.
My preseason projections are based on history, and unfortunately, Yordan’s recent history was an injury that caused him to miss the majority of 2025.
My model weights the most recent seasons more heavily and this resulted in a projection of only 91 games for Yordan.
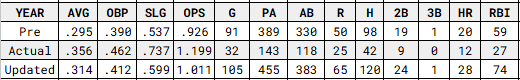
That said, no one could have predicted the start Alvarez is off to, and the updated projections reflect his sizzling start and the reality that it’s unlikely to last for the entire 162-game schedule.
In just 32 games, Alvarez has gained: 19 points of average, 22 points on OBP, and 85 points on slug, not to mention 66 PA, 53 at-bats, 8 HR, and 15 RBI.
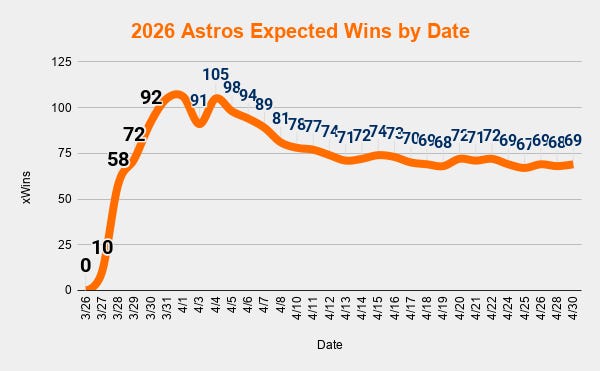
Astros Expected Wins
1-2 and outscored 20-17 since we last spoke.
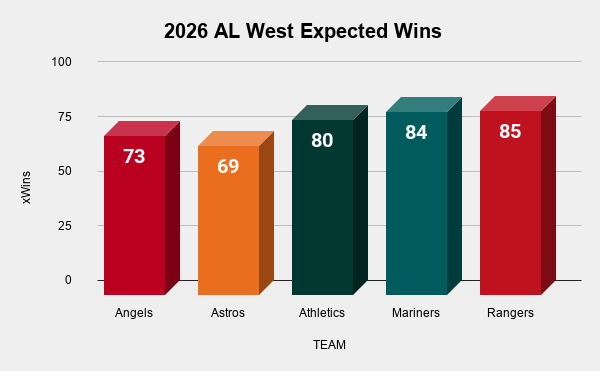
AL West Expected Wins
They are still projected to end last in the AL West.
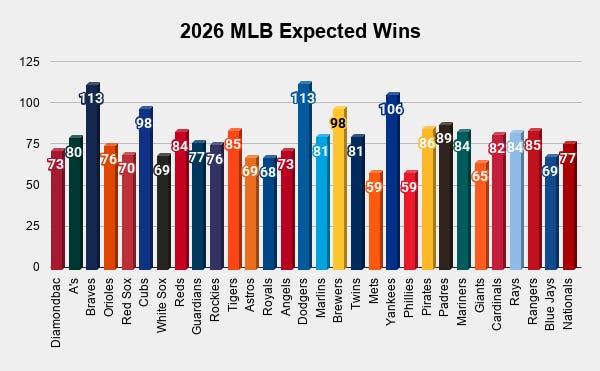
MLB Expected Wins
Thanks for reading!