

Plus Stats
A look at the Fangraphs + Stats and Creating One of Our Own

I find the + Stats helpful in putting context to the numbers we’re inundated with as baseball fans.
Knowing that Jake Meyers hit .292 is one thing and most of us intuitively understand that’s a good batting average in today’s MLB.
But how good? 20% above the MLB average in 2025, it turns out and that’s easily discerned at a glance by the AVG+ stat.
There are similar stats for OBP, SLG and, of course, wRC, but the most important offensive stat doesn’t seem to have a + version (let me know if I’m missing it).
In my non-scientific research, no stat correlates more to runs scored than wOBA.
You’re probably familiar with wOBA, but if not, you can read all about it here.
The Cliffs Notes version is that wOBA weights the different ways of getting on base, hence the “w” at the beginning.
In short, a home run is weighted more than a triple, which is weighted more than a double, which is weighted more than a single, etc.
The weights change from year to year.
There are no accidents at the top of the wOBA list for the league:
Judge
Kurtz
Ohtani
Springer
Acuna
To get the wOBA+, I simply divided each player’s wOBA by the league average and multiplied the result by 100 to come up with (estimated) wOBA+.
All other numbers in the chart below come directly from Fangraphs.
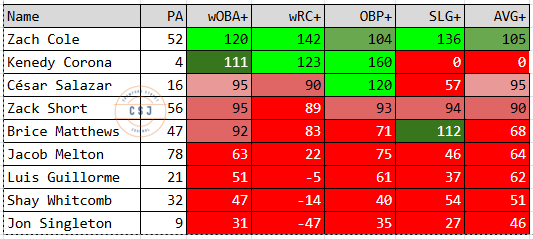
I’ve also separated the players by 100+ plate appearances and <100 plate appearances for readability.
Finally, I color-coded the charts so “green is good” and “the redder the deader”.
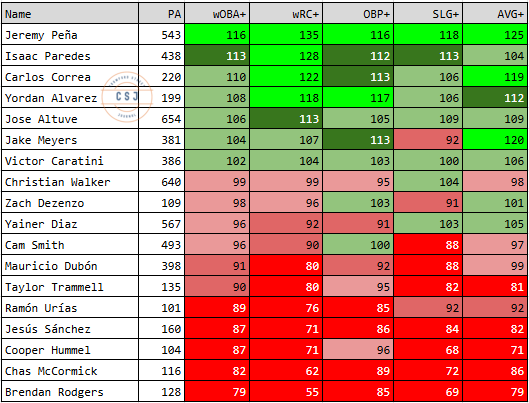
110 or higher is fine as far as I’m concerned, but the 110 to 115 range and higher is where I begin to take notice.
On the flip side, below 100 is, of course, below average, but when you see numbers dip below 95, it’s a red flag - literally in these charts.
In many ways, these charts confirm what we know to be true: Jeremy Pena had an excellent offensive season and the loss of Isaac Paredes down the stretch was crushing.
But some others may not be as obvious.
Cam Smith was worse than I thought overall, while Zach Cole, who I thought was more of a true outcome guy, actually was more balanced (105 AVG+, 104 OBP+) in most categories, small sample acknowledged.
Many Astros fans feel the catchers were terrible offensively, and they may have been situationally, but overall, you have two decent-hitting catchers, though Yainer never fully recovered from his slow start and had the worst O-Swing% in baseball.
It also goes to show why average isn’t everything, or even the most important thing, when creating runs.
Jake Meyers hit 38 points higher than Isaac Paredes, but lagged in the other numbers, including the two most important: wOBA and wRC+.
Meyers had just 20 extra-base hits in 381 plate appearances, creating fewer runs than others who had much lower averages.
Finally, I knew Jesus Sanchez wasn’t good with the Astros, but this shines a brighter light on his struggle. Sanchez was at least 13% below average in every category and as low as 29% below average in creating runs.