Updated Projections - Game 88 of 162
I'm back...for now
Composition of Projections:
2023 Actuals: 54.3%
Preseason Projections: 45.7%
Season Projections
Lots of updates and tidbits.
Corey Julks’ hot streak places him atop the projected batting averages. More on Julks below.
Alvarez now projecting under 100 RBI, with Tucker right at 100.
I’ve added stolen bases to the projected stats and Julks leads that category, too.
Despite Dubon’s good season, he’s no Altuve. While the batting averages are fairly close, the OBP and Slug aren’t close and one look at ISO Power clinches the deal. Altuve’s ISO is .215 and Dubon’s is .124. That means 21.5% of Altuve’s at-bats end in extra-base hits and only 12.4% of Dubon’s do. The only regulars/semi-regulars below Dubon in ISO are Abreu and Maldonado. He’s a singles hitter in a power era.
Raise your hand if you projected 122 IP from J.P. France this season. Talk about seizing an opportunity.
Ronel Blanco has done pretty well, too, though the home run ball is killing him.
Despite giving up a couple of home runs the last couple of times out, Hector Neris is having a very good season and is projected for 70 appearances. Per Fangraphs Neris has 18 shutdowns and just 3 meltdowns.
Astros 162
I’m planning on catching up on this over the All-Star Break, but surgery awaits, which means that’s a plan and not a commitment.
Bullpen Usage
Days off headed into the home stretch before All-Star Game:
Abreu 1 Martinez 0 Maton 3 Montero 0 Neris 1 Pressly 1 Stanek 2
Today’s Pitching Matchup
NOTE: I’ve sorted these by wOBA against to make it easier to determine who to watch for (or bet on, if you are so inclined).
Next to no experience against the Mariners for Brown.
Meanwhile, Castillo has more experience against the Astros with Tucker and Pena having success.
K Prop
The number for Brown is 6.5 and he doesn’t have enough history for me to bet, but Seattle strikes out more (25.8%) than any team in MLB except the Twins.
Odds
Astros are -116 on ML and -205 +1.5. I like the Astros here with Brown starting and leverage arms theoretically available.
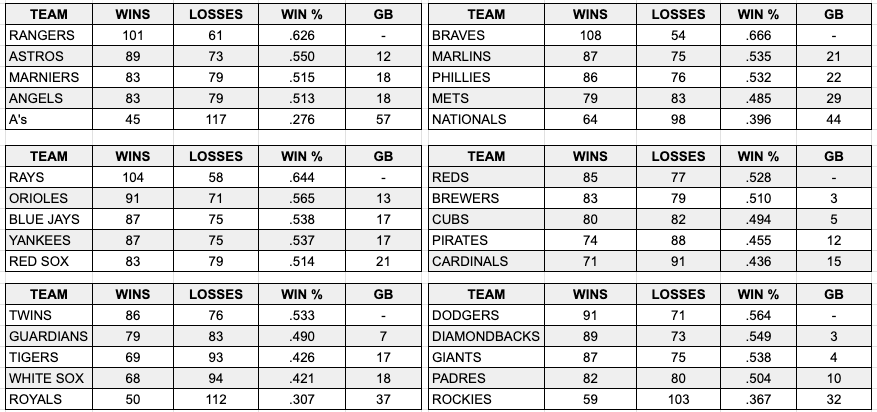
Projected Standings & Luck Rankings
The Rangers have come down a peg. At the game Monday, we sat over the Rangers bullpen and had no idea who most of those guys were, with Chapman an obvious exception. Expect the Rangers bullpen to be a problem, hence trading for Champman.
Current Playoff Projections:
AL Division Winners: Rangers, Rays, Twins
AL Wild Cards: Orioles, Astros, Blue Jays or Yankees
NL Division Winners: Braves, Reds, Dodgers
NL Wild Cards: Diamondbacks, Giants, Marlins
The Marlins continue to defy the odds and are 21-5 in one-run games.
A reminder that a positive number means the team is lucky, 0 means neutral and negative means unlucky.
Most of this revolves around one-run and extra-inning games, with a dash of run differential and actual wins-losses tossed in.
The Marlins are 21-5 in one-run games and 4-1 in extras. The Reds are 20-15 in one-run games and 7-3 in extras.
On the flip side, the Padres are 5-15 in one-run games and 0-7 in extras.
The most interesting case is the Royals, theoretically the unluckiest team in baseball.
Yet, the Royals are 11-10 in one-run games and 1-3 in extras. What gives?
Using the Pythagorean Theorem for baseball the Royals should be 28-60, three games better than their actual record of 25-63 and my model says they should be 29-59, 4 games better than they are.
This chart can be used to predict regression to the mean, both positive and negative.
Expect the Marlins, Reds and Orioles to regress to the middle, as should the Cubs, Padres and Royals in reverse.
I’ll plant these numbers here to evaluate down the road:
Marlins 51-38 .573 ↓
Reds 49-39 .557 ↓
Orioles 51-35 .593 ↓
Royals 25-63 .284 ↑
Padres 41-46 .471 ↑
Cubs 40-46 .465 ↑
May not mean anything notes of the day
Near the end of June, I mentioned that I was optimistic about Corey Julks, noting his low OPS was largely due to walking 4 times in his first 139 plate appearances, but has improved markedly since. He’s a rookie and is going to be up and down, strike out a lot and make mistakes, but he’s also a ball of energy on a team that needs energy. His .386 BAPBIP is unsustainable, but he’s slashing .289/.333/.418 with a .328 wOBA, 110 wRC+, 108 OPS+ and 15 stolen bases (projects to 28 for season). Again, regression awaits, but his BB% is up to 6.4% and he’s playing well. Whether that means he’s a trade piece, an insurance policy or the future is an interesting question.
In the last 6 games Julks is slashing .524/.583/.619
Since June 1:
Kyle Tucker: .333/.403/.553 wOBA .407 wRC+ 165
Chas McCormick: .309/.385/.519 wOBA .390 wRC+ 153
Jose Abreu: .289/.315/.504 wOBA .345 wRC+ 122
Note that the numbers for all three of the above have dropped since the last update.
Brandon Bielak threw 24 changeups Tuesday and got 11 swings and 5 whiffs (45%). It’s by far his best pitch, as opponents are hitting only .194 on it and it’s accounted for 21 of his 41 strikeouts.
Bielak averaged 0.5 MPH more on his fastball and it had more spin than his season average.
Thanks for reading!


