Updated Projections - Game 97 of 162
A "crowd" of 4,757
Composition of Projections:
2023 Actuals: 59.9%
Preseason Projections: 40.1%
One Year Ago Today
Me and Junior were down the 3rd base line when J.J. Matijevic won the first of two with this hit and my phone took a hit.
Season Projections
A big, two-out RBI hit from Tucker, but Dubon got it started and Pena kept it going.
Tucker is projected as a 25-25 guy with 100+ RBI.
5.2 shutout from Bielak. 7+ 1-run innings from J.P. France. Framber up today.
Astros 162
Click on the image for episode 97.
Bullpen Usage
With the exception of Pressly, the bullpen is in decent shape with 3 games to go until an off day.
Today’s Pitching Matchup
NOTE: I’ve sorted these by wOBA against to make it easier to determine who to watch for (or bet on, if you are so inclined).
This matchup seems to favor the Astros in a big way.
and Chas looks primed to continue his torrid streak…
K Prop
6.5 is the number for Valdez and my number is 5.73. Going strictly by the numbers, I’ll take the under as long as it’s 6.5 or higher.
Odds
Astros -290 on the MoneyLine and -144 -1.5. The only way to go is - 1.5, but with the putrid display on offense last night, I’m not doing it. No bet for me.
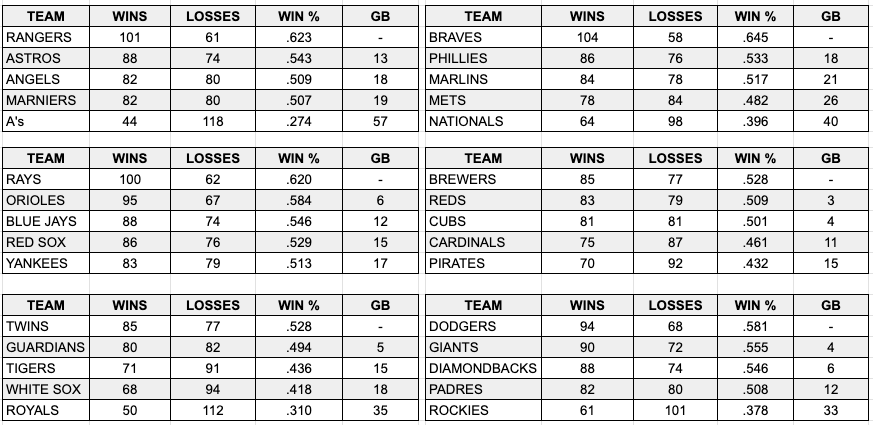
Projected Standings & Luck Rankings
The Orioles have overtaken the Rays in real life, but I’ve still got the Rays as coming out on top. Why? Read on.
Luck Rankings
And there you have why I still have the Rays (at least currently) in the AL East. Baltimore is one of the “luckiest” teams in MLB.
How so? The Orioles are 17-9 in one-run games, while the Rays are way down at No. 25 in the luck rankings.
This very much favors the Rays moving forward.
May not mean anything notes of the day
The Astros have had 44 quality starts in 97 games [45.4% of starts].
Houston is 32-12 [.727] when getting a quality start and 22-31 [.415] when they don’t.
Starters are 26-8 in quality starts [.765] and relievers 6-4.
Average Astros Quality Start:
6.61 IP 4.27 H 1.61 R 1.39 ER 6.09 K 1.39 BB 1.89 ERA
Corey Julk’s last home run was on June 18, 86 plate appearances ago. Julks is still hitting [slashing .292/.358/.354 in July with 3 doubles in 53 plate appearances], but not hitting for power.
Julks is a good example of what you hear vs. what’s actually happening.
We hear a lot about how hard he hits the ball on the broadcasts, yet Julks’ HardHit% is 32nd percentile, Max Exit Velocity is 71 and Average Exit Velocity is 23rd.
Jeremy Pena since June 1: .211/.263/.281 with 2 HR 7 RBI and 30 K in 137 plate appearances.
Since Pena’s return from “neck discomfort” on July 5:
.154./195/.231 with 1 HR and 3 RBI in 41 plate appearances.
Rafael Montero since his blow-up in Los Angeles on June 25:
6 G 9.1 IP 3 H 3 R 2 ER 6 K 4 BB 1.93 ERA 5.00 FIP 4.82 xFIP
an extraordinarily low .091 BABIP during this time indicates some luck may be involved.
Framber Valdez’s BB% by season:
2018 15.6
2019 13.4
2020 5.6
2021 10.1
2022 8.1
2023 5.9
Thanks for reading!


