

What Are The Odds?
Astros hanging on by a thread in the AL West
The image above is honor (and hopes) of Yordan Alvarez returning to the lineup for the first time since early May.
It hasn’t been officially announced as of press time, but hopefully it’s just a matter of time.
As the lineup heals a bit, the pitching staff continues to suffer, especially their elbows and arms, with the latest being Bennett Sousa, he of low expectations and fabulous results this season.
Just when you think it couldn’t get any worse, it has gotten worse.
Three of four in Baltimore was not bad, though not always pretty, but we’re at the point of the season where you don’t worry too much about “how it looks” as long as it goes in the win column.
Expected Wins, Should Be Standings and Projected Standings
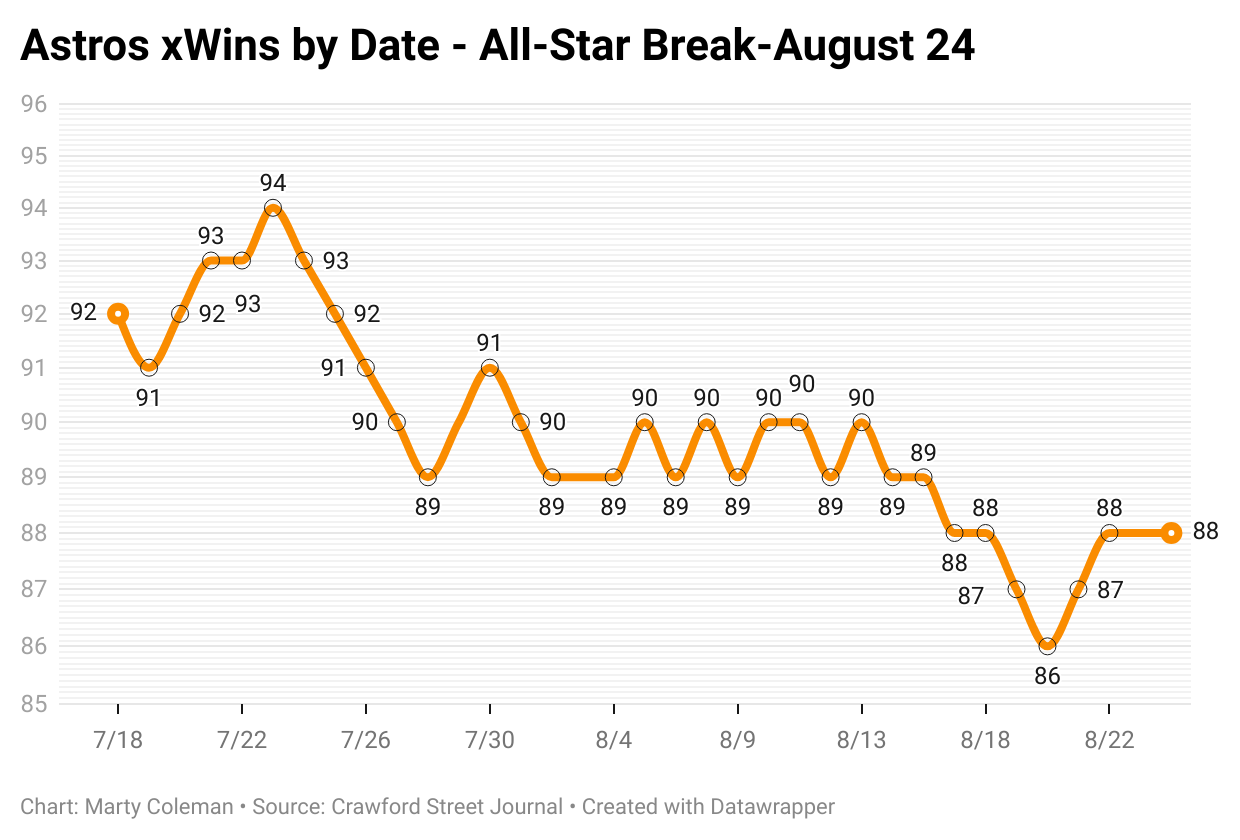
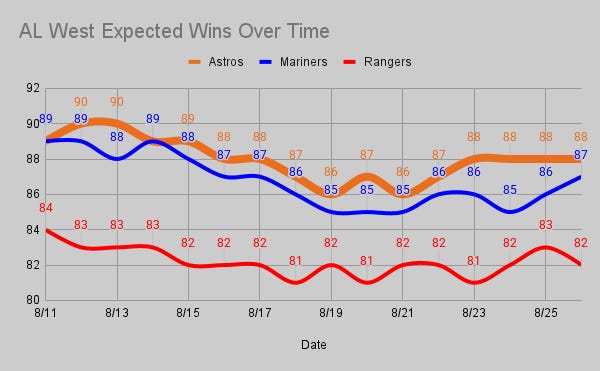
The expected wins since the All-Star Break view gives a clearer picture than the season-long chart, and it shows the Astros have lost 4 expected wins since the break.
It’s not necessarily that the Mariners have been great (20-16), this is more about the Astros (16-19).
The Should Be Standings
I may be the only one interested in this, but this is how the standings “should be” given the won-loss records AND run differential.
Texas is so high because they have a run differential of +59 compared to the Mariners +25 and Astros +19.
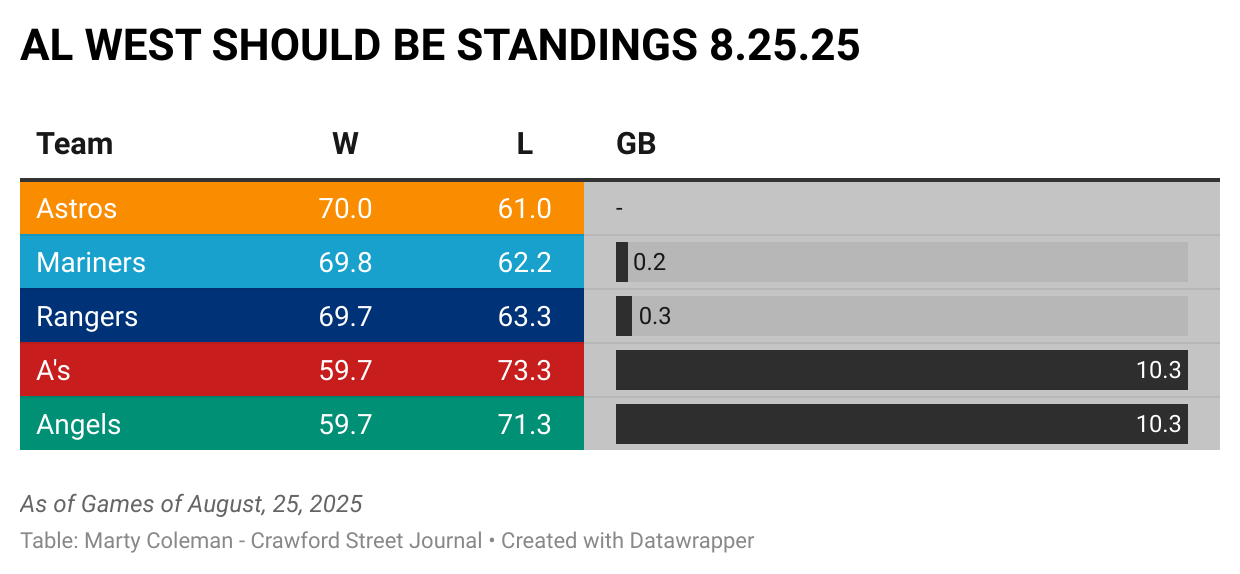
This is where my projected standings stand out over the Pythagorean Wins formula.
The Rangers would have 73 wins in a Pythag calculation, while I have them at 69.7.
Actual wins and losses matter in my formula and there is no way for the Rangers to make up their 67 losses.
That’s a huge piece of why the Rangers are projected to end up 6 games behind at season’s end in my Projected Standings.
Projected Standings
If the wins and losses and run differential continue at the current rate, we would expect the final AL West Standings to look like this:
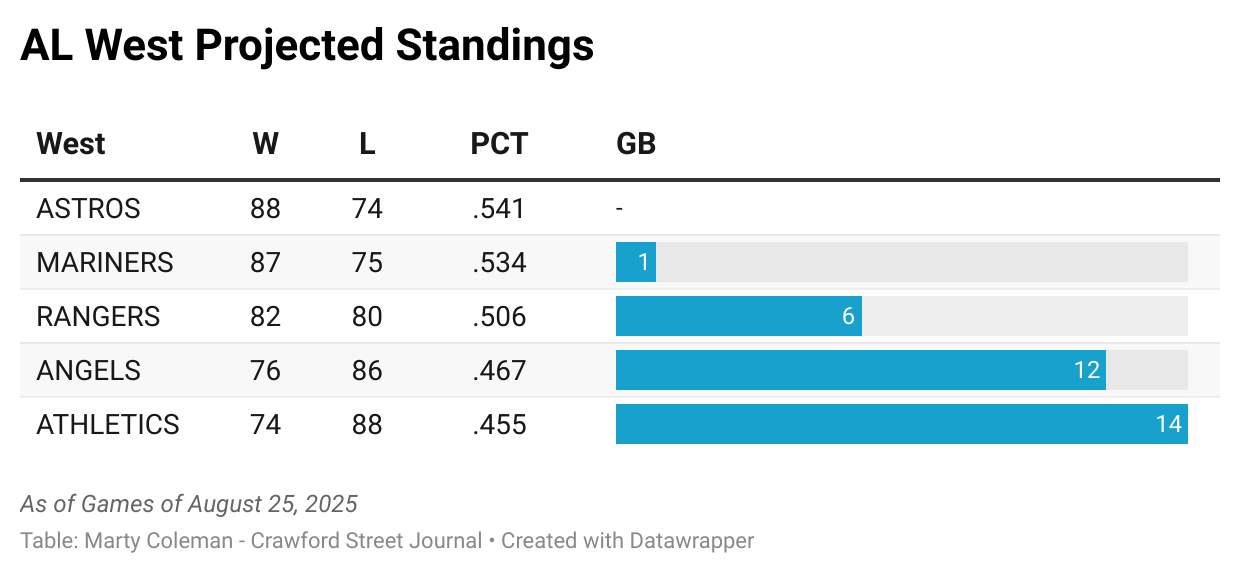
That three-game series with Seattle in late September at Daikin Park looms large, at least at this point.
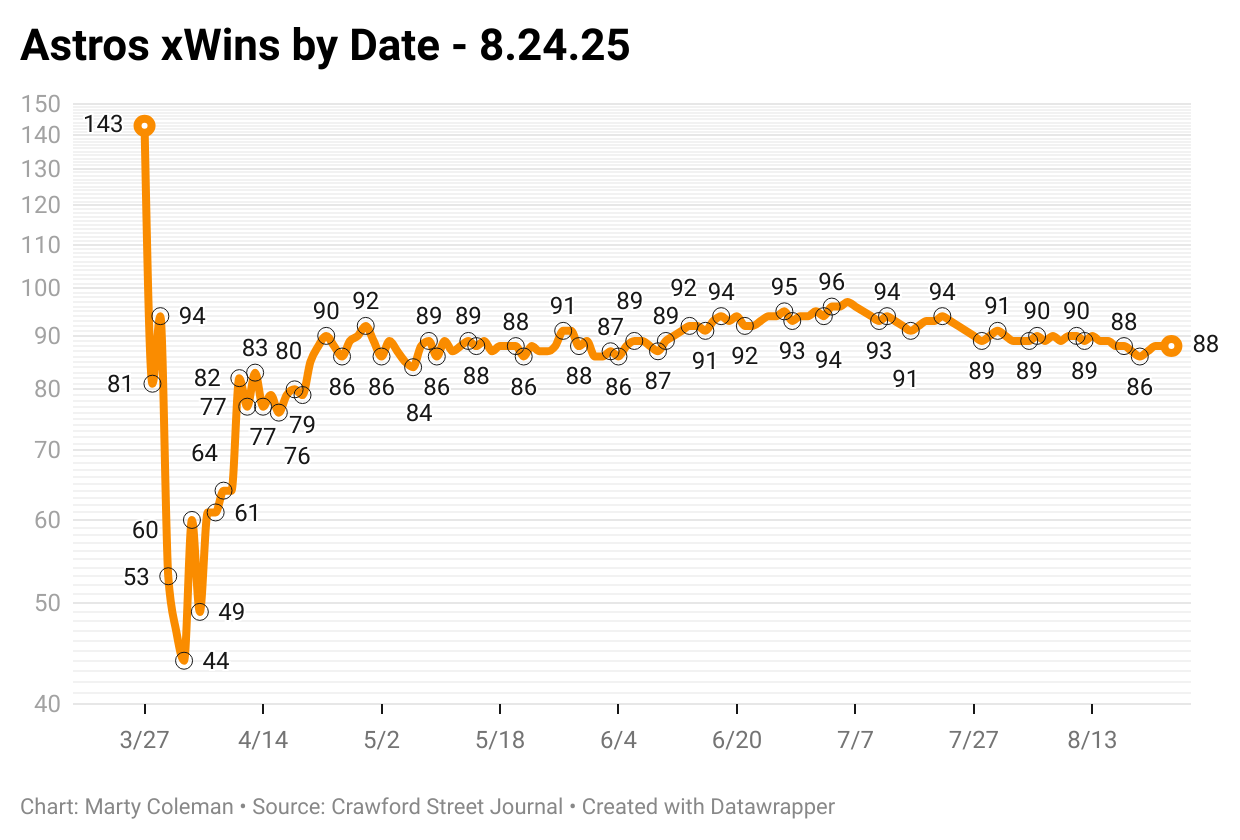
Finally, here are the three contenders expected wins over time:
Professional Projections
It’s a little confusing over at Fangraphs, where in their projected standings, they have Houston and Seattle finishing with 88 wins apiece, but have the Astros with a .546 win % (88.452 wins) to .542 for Seattle (87.804 wins).
Over on the playoff odds page, the site assigns the Astros 88.6 wins and the Mariners 88.0.
I haven’t tried to figure out the reasons for the differences, but just know it’s close.
On that same playoff odds page, the site gives Houston a 54.2% chance to win the division, 93.4% chance to make the playoffs and 5.1% chance to win the World Series.
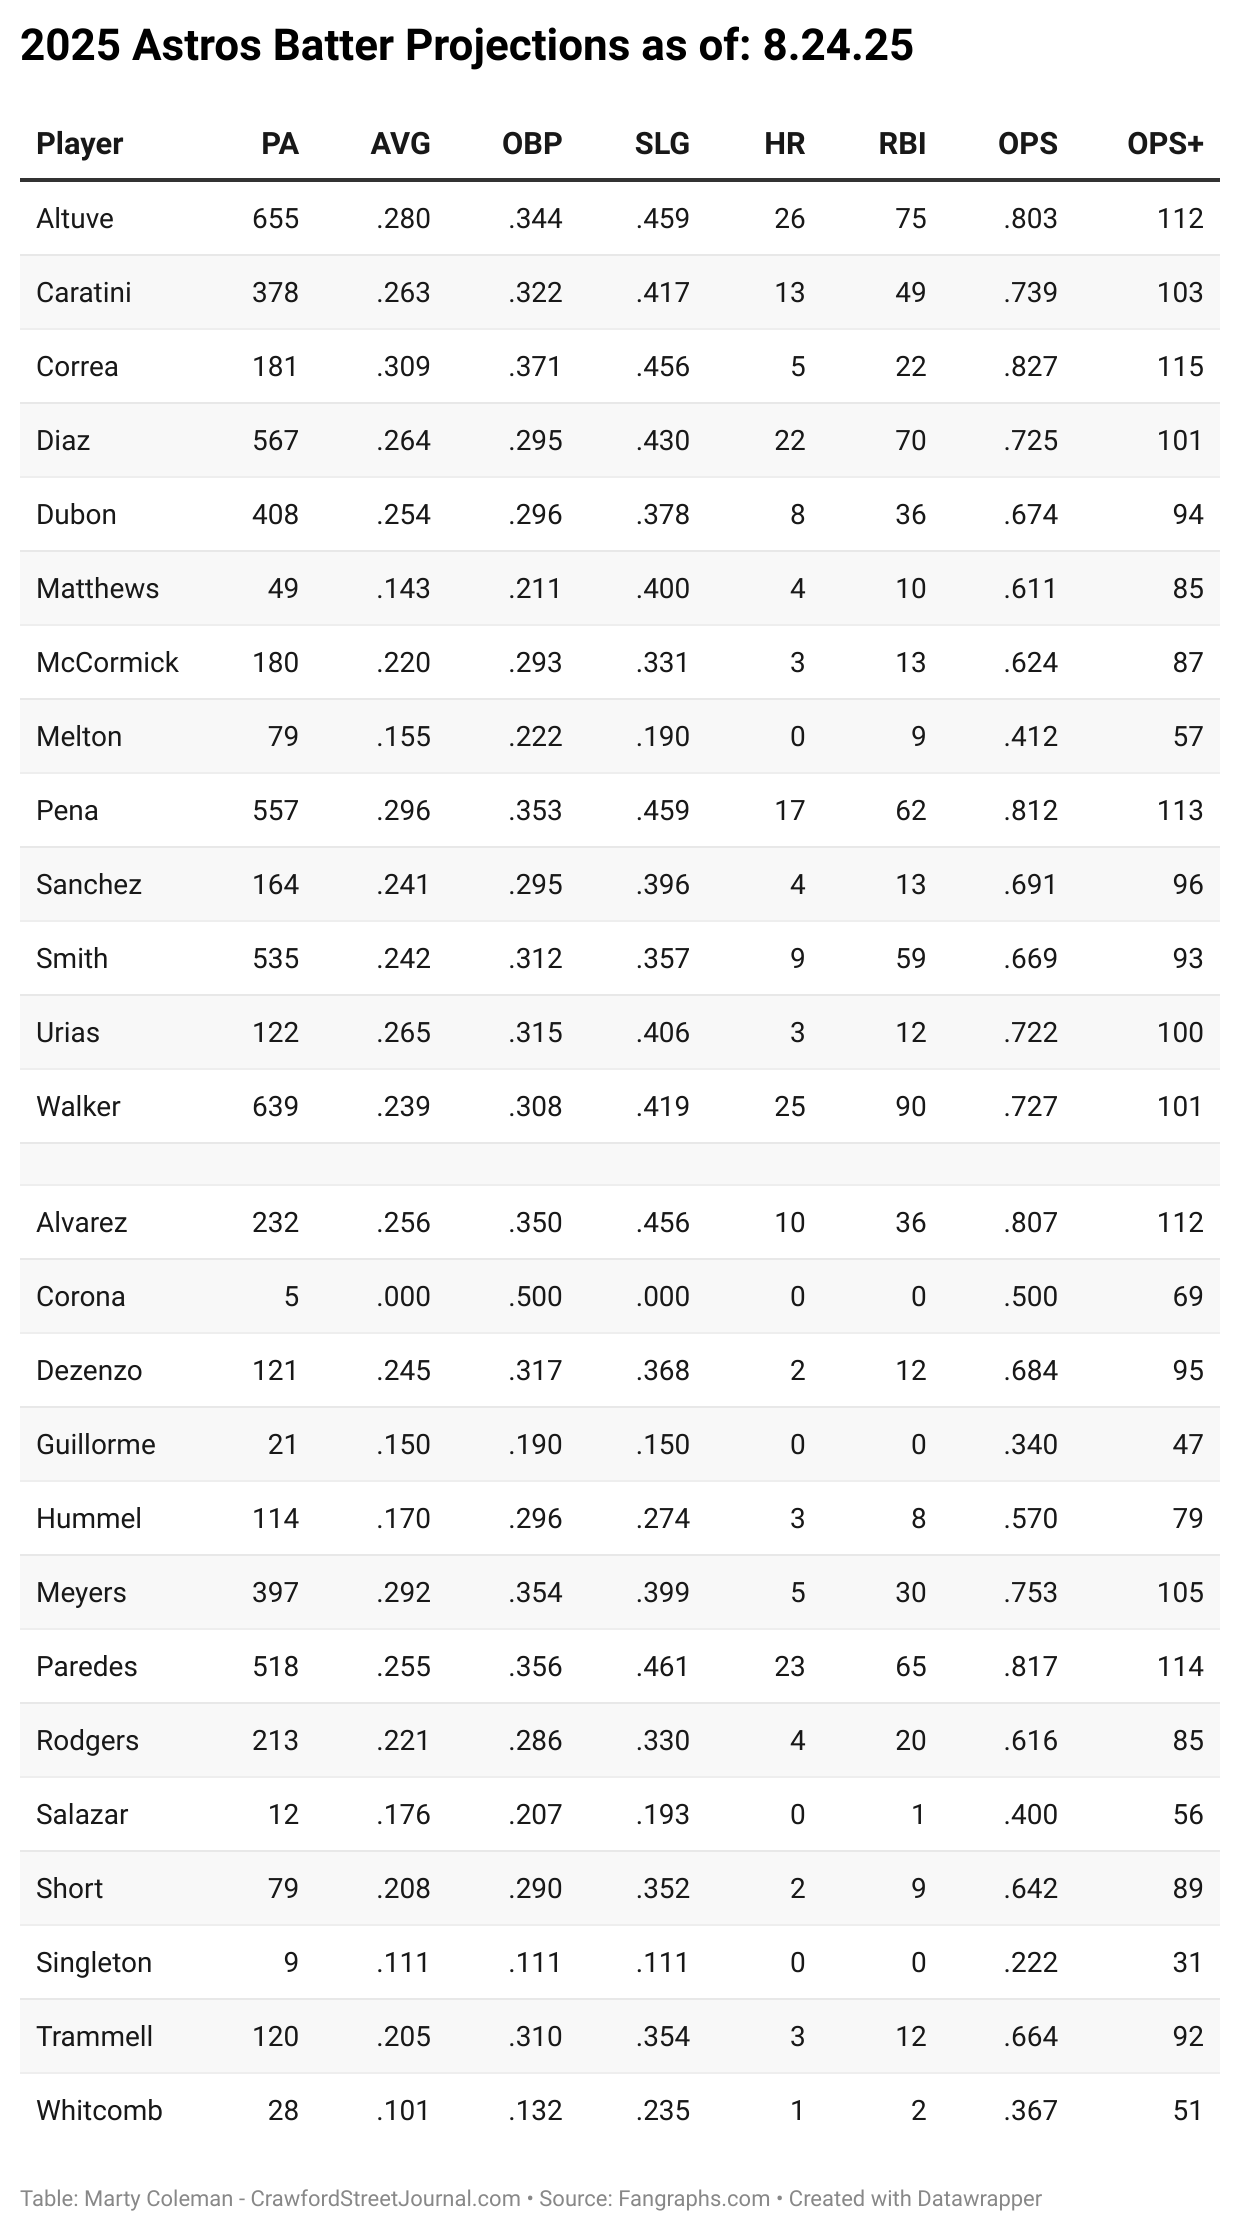
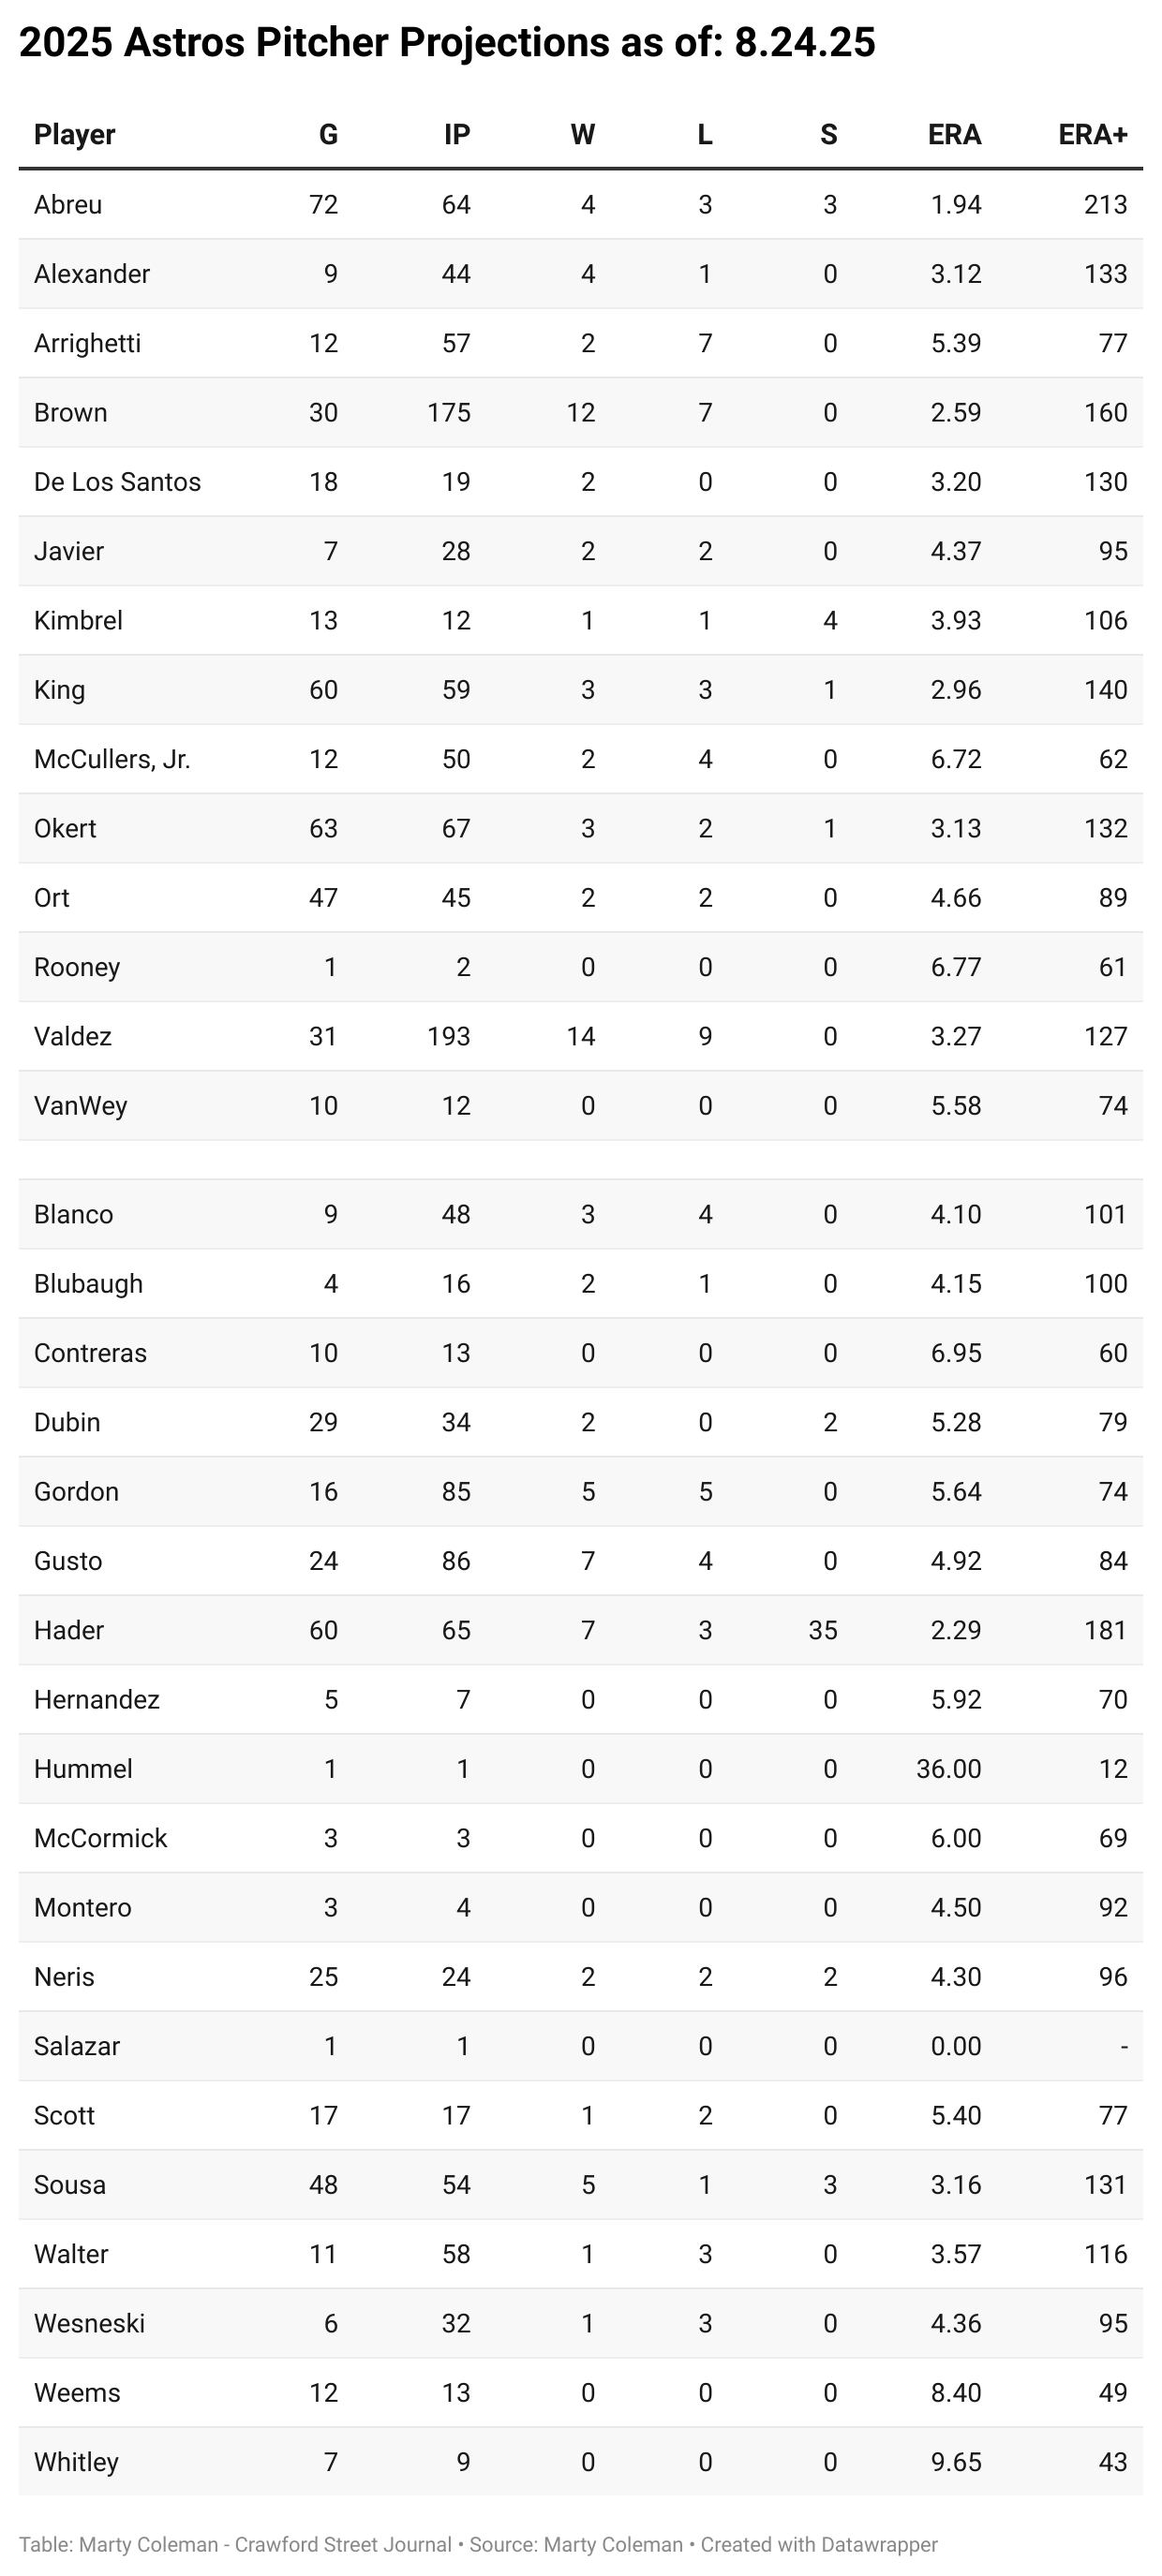
Batter and Pitcher Season Projections
Carlos Correa has been incredible since his return, slashing 349/.407/.494 with a .393 wOBA and 155 wRC+ over 91 plate appearances and playing a sterling third base with 1 OAA.
On the flip side, Jacob Melton continues to struggle since his recall, slashing .083/.154/.083 with a .122 wOBA and -31 wRC+.
Melton may be the future, but I’m worried about the present and sensing he may not be the best option in 2025.
I still project Yordan to hit 10 home runs and record 36 RBI, which means to reach those numbers, he’d have to finish the season with 7 more homers and 18 more RBI.
Craig Kimbrel isn’t what he once was, but the guy has still recorded 67 saves in the three years before 2025.
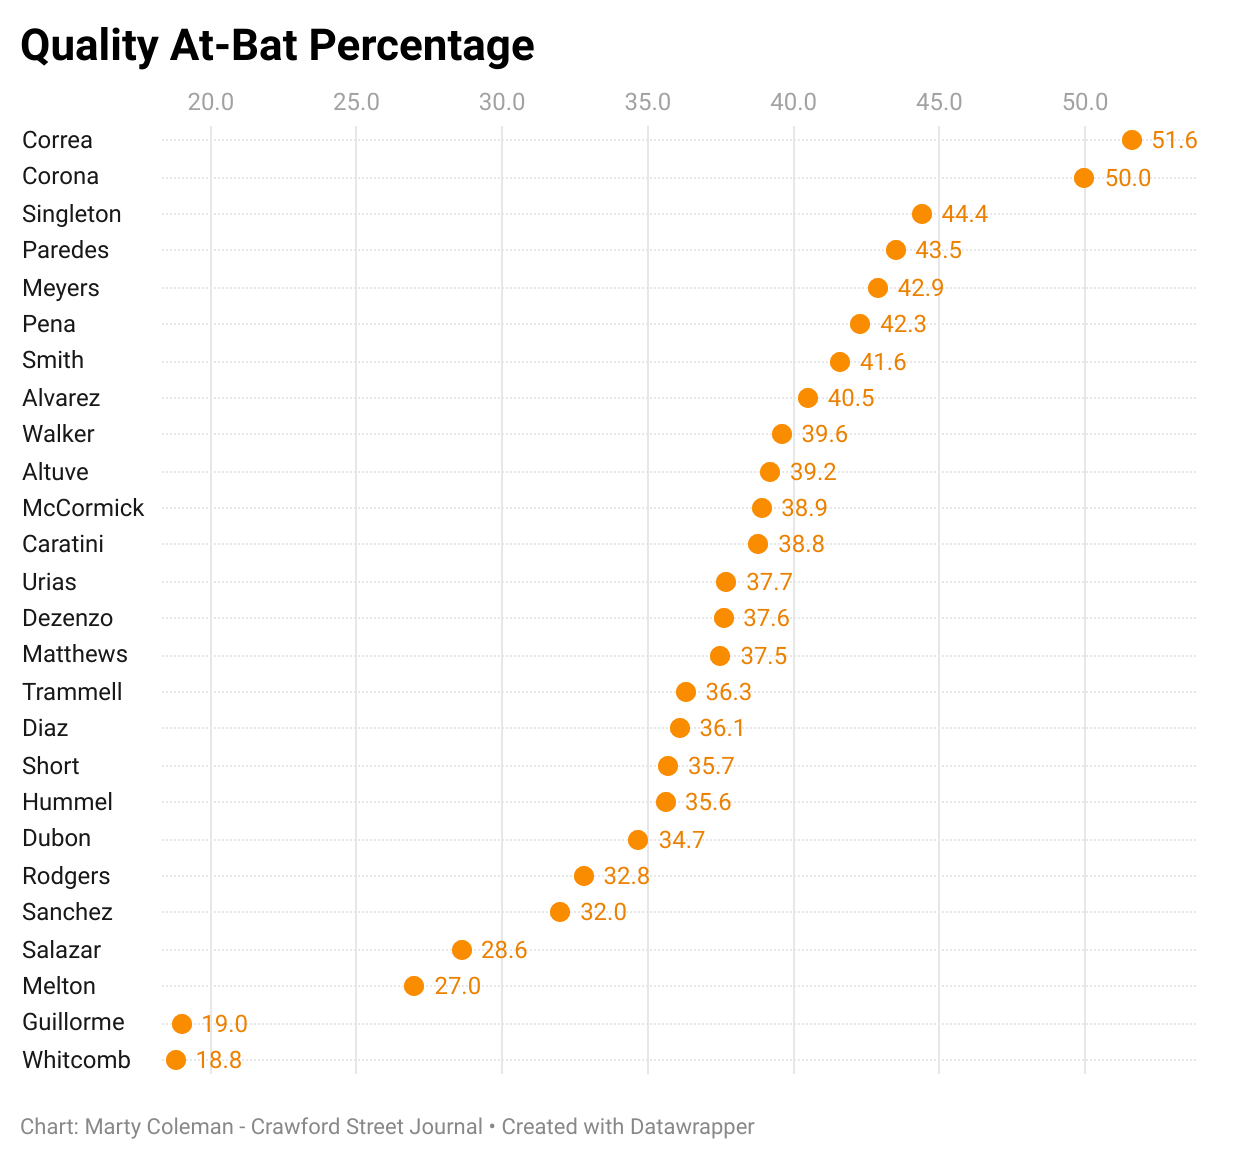
Quality At-Bats
A new look, which is hopefully easier to read, but also gives you a visual sense of the differences between players.
Correa is in a league of his own since his return, Kenedy Corona notwithstanding.
Team average is 39.1.

Rando Stats of the Day
Since we last spoke, Victor Caratini has had a couple of big plate appearances as a pinch-hitter, so hopefully that corner is turned, but on the season, Caratini stands like this:
C: .321/.382/.512
1B: .200/.188/.300
DH: .205/.270/.330
PH: .143/.235/.214
With the expected return of Yordan, it would seem Jose Altuve’s DH time will be reduced and Altuve, already down from his torrid July, has been best as a DH this season:
2B: .261/.331/.433
LF: .271/.330/.429
DH: .296/.356/.506
Christian Walker’s recent power display has improved his August numbers to .238/.322/.525 with a .357 wOBA and 130 wRC+ for the month, boosted by six home runs and 17 RBI (both lead team).
Hunter Brown and Jason Alexander lead the rotation in August with ERAs of 1.44 and 1.54, respectively, while Spencer Arrighetti (6.52) and Framber Valdez (7.33) have struggled.
Bryan Abreu has a 0.00 ERA in 10 August appearances, covering 11 innings and includes 3 saves and a 97.2 MPH average on his four-seam fastball, which equals his season average.
The Astros are 6-1 in games started by Jason Alexander.
Not counting Cesar Salazar, Cooper Hummel and Chas McCormick the Astros have used 30 pitchers, along with 26 position players.
The Astros have gone 56-44 since Yordan Alvarez landed on the disabled list (16-15 prior).
As always, thanks for reading!