

When .2 is a Huge Number
Adding context to the Astros free-swinging ways
There’s been a lot of talk around the Astros’ free-swinging ways that induced what I like to call “Easy Innings” for the opposition, counted at 10 pitches or less.
It felt like Astros pitchers were throwing 20 or more pitches in way too many innings, while their opponents were in single digits or perhaps the mid-teens.
Inning after inning, the stress and wear and tear were accumulating, even when the Astros were tied or ahead.
I often tell my son that we notice things more because we watch the Astros 150-155 games a season, and you tend to notice patterns you wouldn’t notice if you watched them 20 or 30 times a year.
Things like how many times Alex Bregman popped up, for example. An opposing team’s fan likely wouldn’t realize that seeing Bregman 7 or 8 times a season, while we noticed it pretty quickly.
But it’s also a double-edged sword. Bregman popped up a lot, but that swing also created a lot of home runs.
The same could be said of the Astros penchant for swinging at the first pitch: It leads to easy innings for the opponent, but it also leads to “ambushes” where an unsuspecting pitcher grooves a ball Altuve hits to Sugar Land in the bottom of the first, for example.
This is where context and game situation are important. No one cares if Altuve hacks away at the first pitch of the game, but if it’s the 7th inning and your pitcher just had a 15-minute half inning of 30 pitches, maybe you take a pitch or even two.
Multiply this by 8, giving Isaac the benefit of the doubt.
But how bad is the problem really?
The Data
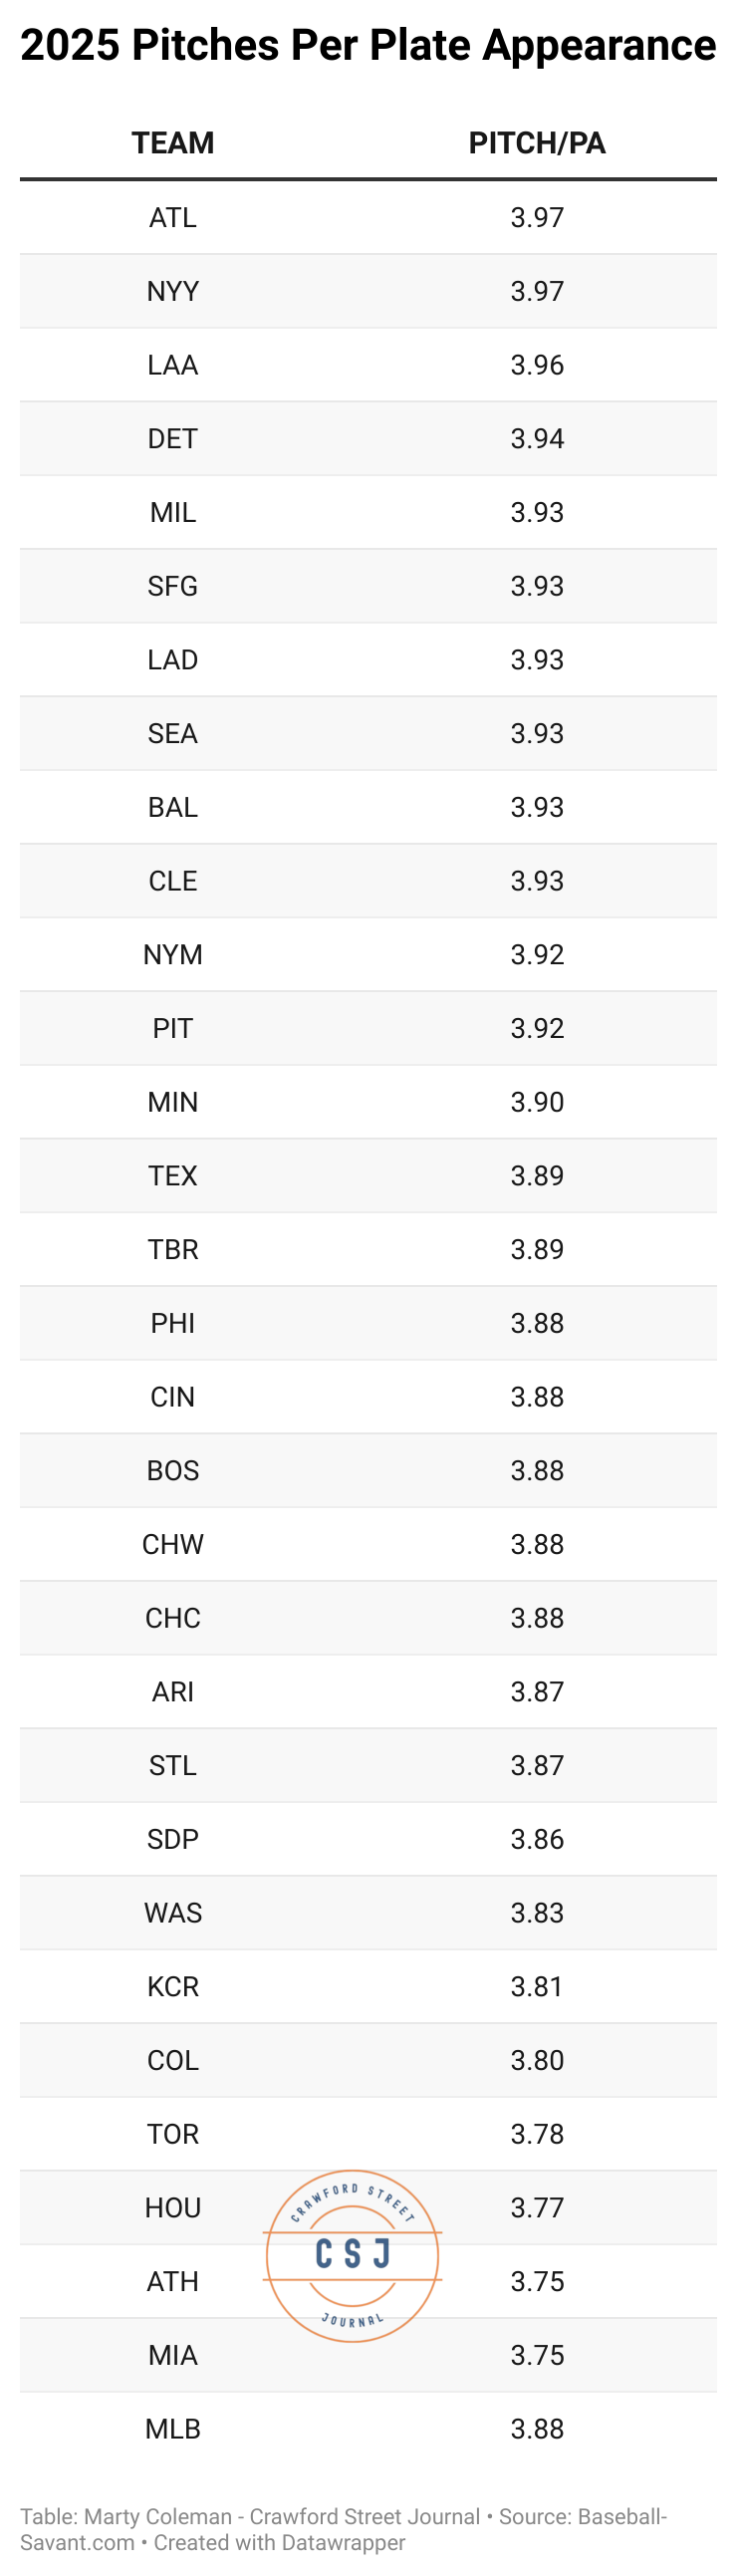
The Astros were 28/30 in terms of the raw number of pitches seen per plate appearance, but they only saw .20 fewer pitches per plate appearance than the “best” teams did.
What’s the big deal, right? Right?
Over the course of the average game, that means the Astros saw about 7.5 pitches fewer (~37.5 PA/G *.2) than the best team would have.
Over the course of the season, that means the Astros saw 1,217 fewer pitches (7.5 * 162) than the best team would have.
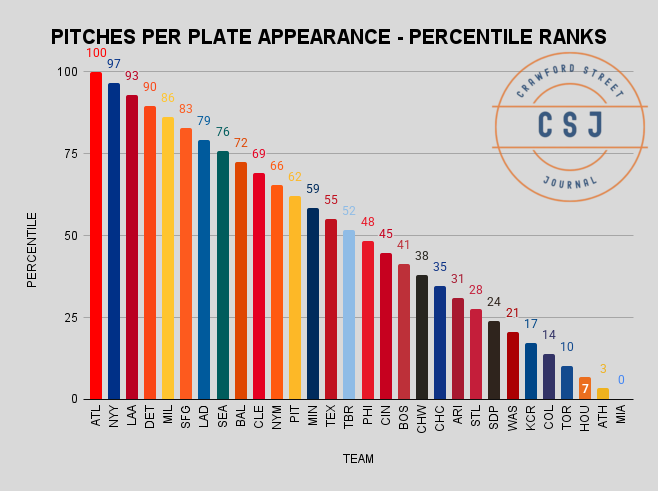
Suddenly, that seemingly insignificant .2 has turned into a real problem, and the graph below puts an exclamation point on that fact.

If I had used a normal column chart the differences between the Braves and Marlins would be minuscule - 30 teams with a total difference of .22 between the top and bottom.
But put into the context of percentiles, much like Baseball Savant uses, the Astros show up in the 7th percentile in pitches seen per plate appearance.
Context Remains Important
Do you have to see a lot of pitches to be good? It depends.
The Dodgers were 7th and they won the World Series and the Blue Jays were 27th and they almost won the World Series.
The Yankees mashed and they were 2nd, the A’s did plenty of mashing and they were 29th.
In other words, it depends on the makeup of the team, including the pitching staff.
An ailing (and young) pitching staff needed the hitters to see more pitches, a lineup without Yordan’s power and dealing with injuries needed to get men on base, stress the opposing pitchers and win in a different way than they had previously.
They simply didn’t have the team to do it.
At least three times a year I use this saying, so vets of this site please forgive me, but perhaps newer readers will get something from this.
Someone once asked a basketball coach what he could do to get his team to be better at free-throw shooting and he replied, “Recruit better free-throw shooters.”
We can ask for incremental improvement and situational awareness from the Altuve’s and Yainer’s on the team and that’ll help, but the real answer is the Astros need more Isaac’s.
Thanks for reading!