

Why We Can't Trust fWAR Projections
fWAR is a zero-sum game, yet almost everyone is projected to be better. Is that even possible?

fWAR is a Zero-Sum Game
One thing I noticed while digging into fWAR is that it’s a zero-sum game.
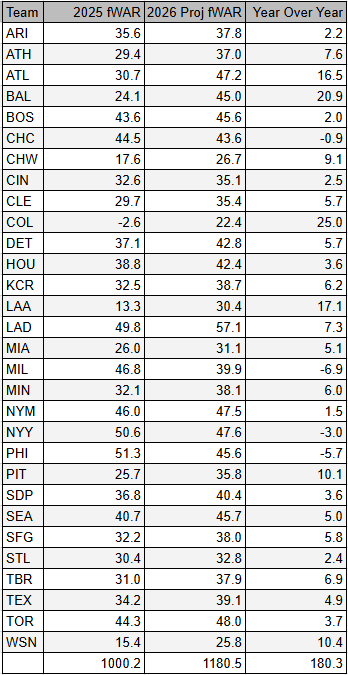
In years when every team plays 162 games, a total of 1000.0 fWAR is handed out.
In years like 2024, where the Astros and Guardians finished with 161 games, it’s a little less.
It also looks like it’s allocated 57-43 (or 570-430) to the batters, which gives me an idea for a future article.
Many of you probably already realized this, but I’m betting some of you didn’t.
This means fWAR is a zero-sum game: You get more, someone else gets less. Your team gets more, another team gets less.
Being the curious type, my next thought was, “Well, let’s see who is projected to improve this year and who’s going to be worse”.
Not Every Team Can Increase fWAR in a Season
Turns out almost every team is projected to have more fWAR in 2026 than they had in 2025, which makes 0 sense given the 1,000 total each season.
The chart below shows the change in fWAR when comparing the actual 2025 fWAR by team to the projected 2026 fWAR by team.
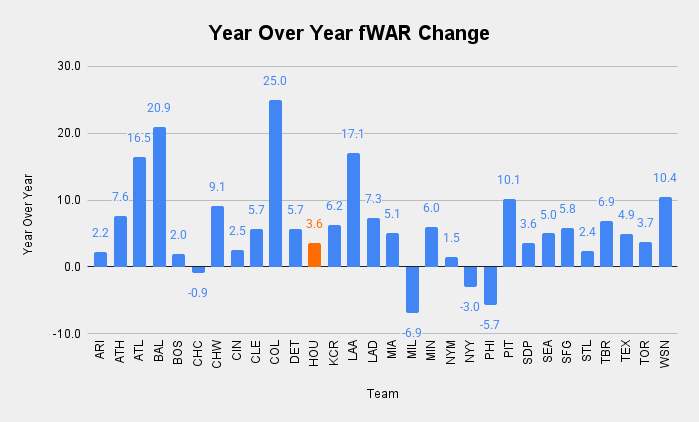
How can you project 26 of 30 teams to have more fWAR when there’s only so much to go around?
Not only that, but it appears the preseason fWAR totals come out to 1180.5, more than 18% of what will be awarded if history is our guide.
*The 2025 total being 1000.2 is due to rounding.
I noted last offseason that very few players have projected negative fWAR, even though this is fairly common in the real world (another project to work).
Can’t Trust fWAR Projections
So, knowing the projected fWAR is not only 18% higher than we should expect but also 18% higher than is POSSIBLE means I’m not going to complete the analysis I had in mind when I started this.
Put another way, think of it as your family budget. We have $1,000 to spend this week, but list out the items we’re going to buy, and it totals $1180, and we say, “Looks good, let’s go with that.”

In theory, I could adjust fWAR to a 1,000 total by lowering everyone by 18%, but that seems like a waste of time to me and is fraught with unknowns.
I’m just going to stop right here and say, “Don’t trust the projected fWAR numbers.”
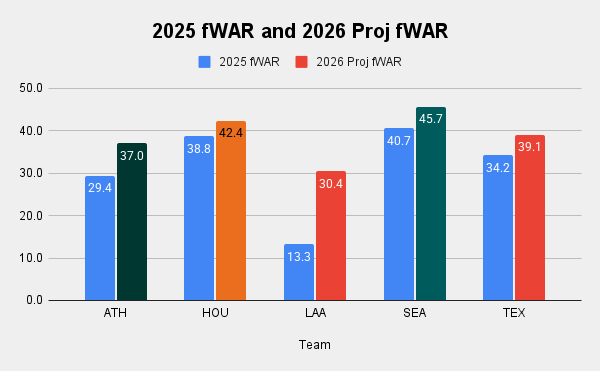
AL West fWAR Projections are Case in Point
Despite my overall reluctance, I’m going to share the AL West team numbers as an example.
SURPRISE, everyone is going to be better.
Insert eye roll emoji here.
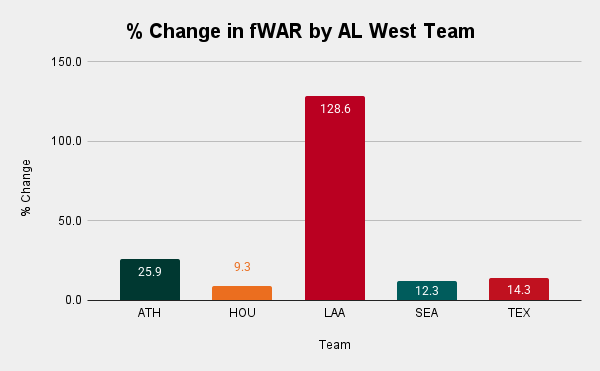
I have no idea what these mean now, but I doubt the Angels improve their year-over-year fWAR by 129%.
More Work to Do
You may think this was a total waste of time for me, and you’d be wrong.
While it was certainly frustrating to learn that the projections don’t account for the upper limit of fWAR and are arguably useless, I found three other projects that I’m interested in.
As always, thanks for reading!
I’m curious. Given that it’s Wins Above Replacement, is it possible that Replacement Level is being redefined to a lower amount of wins? Either way, interesting article.
I suspect this is happening because the preseason projections don't really have many (or any) sub-replacement level players -- since very few players projected to make and stay on an MLB roster are sub-replacement talent -- but in reality, some amount of players will perform at a sub-replacement level due to randomness, talent mis-judgment, etc. Some players _will_ be sub-replacement regardless, but the projections don't really know who will miss their mark and who won't.
So here we're kind of mixing backwards-looking value assessments (last year's WAR) with forward-looking talent projections (preseason forecasts), which have two distinct purposes.